One of the enduring mysteries to me about the whole Dietary Guidelines issue is the extent to which my concerns regarding their effectiveness causes some folks to question my intelligence, knowledge, professionalism, and—I think—prescription drug use.
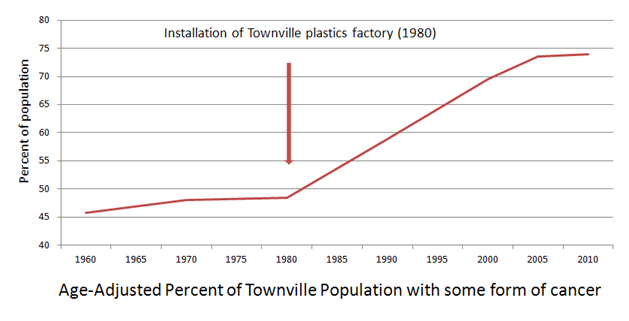
Take the graphic above, which appears to show a relationship in time between one event (the installation of a plastics factory) and another trend (rise in cancer rates). This does not demonstrate cause-and-effect, of course, but I think that most public health officials would be concerned enough about the clear inflection point and the following steep upward trend in disease to want to investigate the potential for a cause-effect relationship, or at least begin to ask some questions.
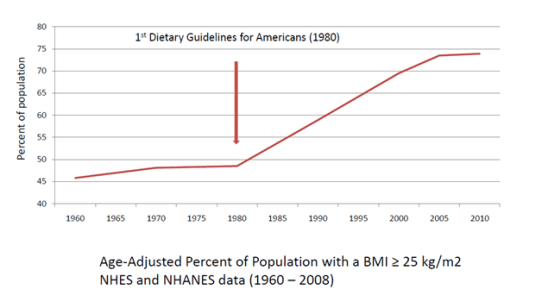
But when the graph looks like this, it’s a different story:
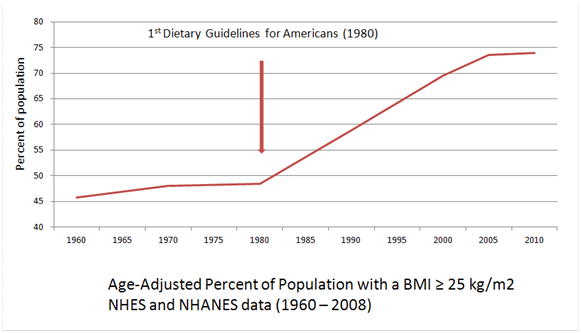
Every time I show someone the above relationship, I get remarks like, but what about physical activity levels? television? women in the work force? desk jobs? automobiles? anything, anything but the Guidelines!
Keeping in mind that the obesity graph above only shows the temporal relationship between when the Dietary Guidelines were implemented and when the rapid rise in obesity took place, I thought I would look at some of the other possible causes that are invoked in the name of avoiding the possibility that we’ve been wrong about public health nutrition for the past thirty years.
It’s not the Guidelines #1: For some reason, Americans got much lazier in the past 30 years than they have ever been before.
I will say right off the bat that we don’t have a lot of clear data about physical activity levels because we didn’t really start paying attention to it until Americans started getting fat. However, the 1983 Public Health Objectives for Americans offer some insight: “The American lifestyle is still relatively sedentary. The proportion of adults aged 18-65 regularly exercising has been estimated at just over 35% . . .” [From: Promoting Health/Preventing Disease. Public Health Service Implementation Plans for Attaining the Objectives for the Nation (Sep. – Oct., 1983), p. 155].
The most recent research—2010—on physical activity levels in America paints a much different picture:
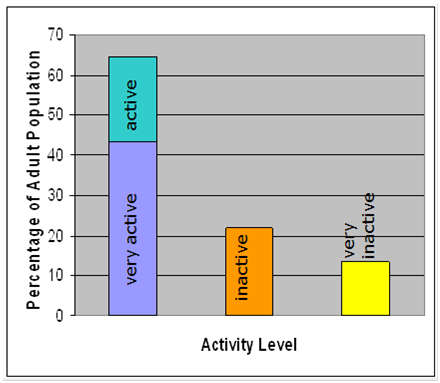
This may not be the complete story, but there is little evidence to suggest that we have become radically more sedentary since 1980. And if we have, one would have to ask just why that would occur?
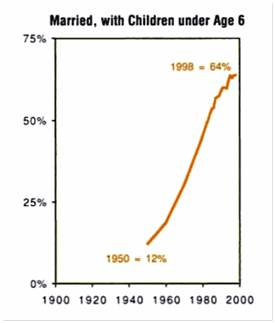
It’s not the Guidelines #2: Moms went to work, leaving the kids in front of TV sets!
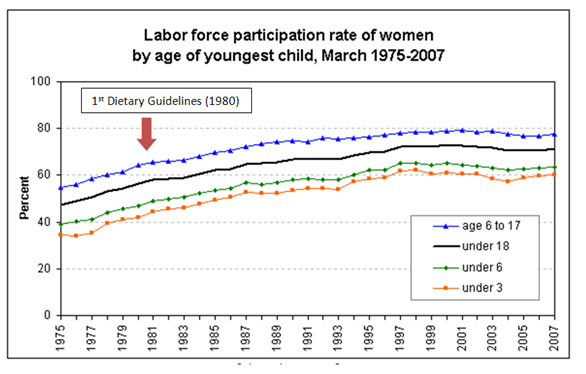
Labor force participation rate of women by age of youngest child, March 1975-2007
Women began entering the workforce, even with small children at home, long before obesity rates began to climb.
It’s not the Guidelines #3: Blame television! Television came along and we all turned into couch potatoes.

Television was in over 85% of American homes in 1960, 20 years before obesity rates began to climb. (However, it is possible that MTV, which debuted in 1980 along with the Dietary Guidelines, is at the root of our obesity crisis—anything, anything but the Guidelines!)
It’s not the Guidelines #4: We used to work at physically demanding jobs!
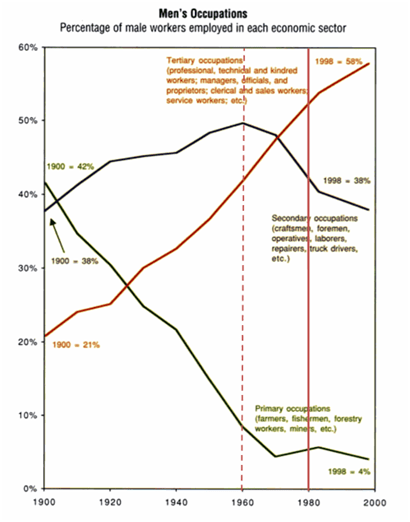
With these wonderful graphs from the book The first measured century: an illustrated guide to trends in America, 1900-2000, by Theodore Caplow, Louis Hicks, Ben J. Wattenberg, I looked for a similar pattern to that of the obesity trend, a parallel trend that might be a primary factor in the rise in obesity in America. The dashed lines represent the beginning of the obesity measurements above (beginning in 1960), while the solid lines shows when the first Dietary Guidelines were released (in 1980). To find some sort of correlated trend, we would want to find a flat-ish sort of line between the dashed line and the solid one, followed by a steep incline after the solid line, showing a concurrent trend. Alternately, we might look for a curve similar to the obesity one, but shifted to the left, showing a trend that preceded the obesity one. I didn’t find either in the transition from manual labor to more sedentary jobs.
It’s not the Guidelines #5: In the past, we used to walk everywhere–or ride our scooters, or our ponies!
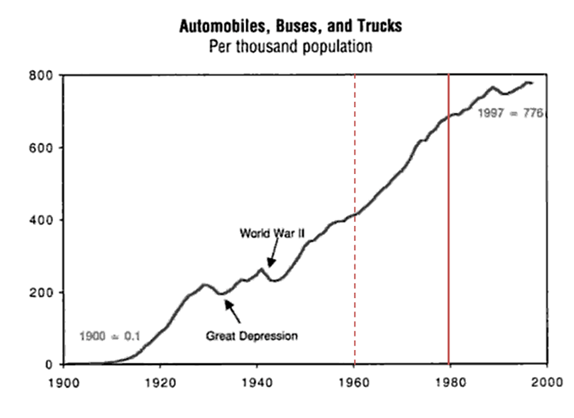
I grew up in the 70s. We rolled around in great big cars without our seat belts on. Not such a great idea, but cars were an integral part of Americans lives long before obesity rates took off.
It’s not the Guidelines #6: Some seismic shift in our eating habits made many of us gain weight at an alarming rate.

Wait a minute—this looks familiar. Hmmm. Dramatic rise in carbohydrate intake? Dramatic rise in obesity! Who’da thunk? And why did we start eating all those carbs? Not because we were sitting in front of the TV while our moms went to work (we were, but that’s not why). We started filling our plates with cereals and starches because the Dietary Guidelines told us to.
References:
Adabonyan I, Loustalot F, Kruger J, Carlson SA, Fulton JE. Prevalence of highly active adults–Behavioral Risk Factor Surveillance System, 2007. Prev Med. 2010 Aug;51(2):139-43.
Gross L, Li L, Ford ES, Liu S. Increased consumption of refined carbohydrates and the epidemic of type 2 diabetes in the United States: an ecologic assessment. American Journal of Clinical Nutrition, Vol. 79, No. 5, 774-779, May 2004
Public Health Reports (1974-) , Vol. 98, Supplement: Promoting Health/Preventing Disease. Public Health Service Implementation Plans for Attaining the Objectives for the Nation (Sep. – Oct., 1983), pp. 1-177