As the Calories Churn (Episode 3): The Blame Game

In the previous episode of As the Calories Churn, we explored the differences in food supply/consumption between America in 1970 and America in 2010.

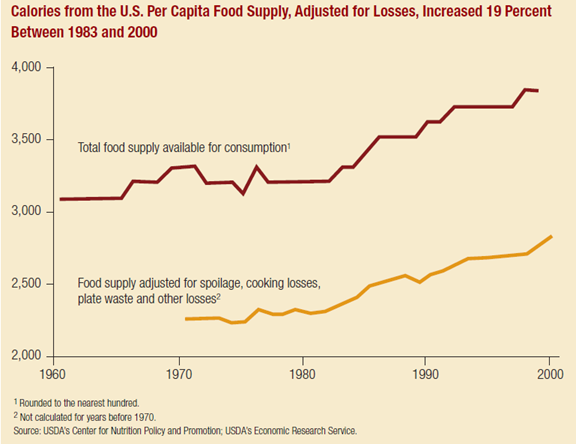
We learned that there were some significant changes in those 40 years. We saw dramatic increases in vegetable oils, grain products, and poultry—the things that the 1977 Dietary Goals and the 1980 Dietary Guidelines told us to increase. We saw decreases in red meat, eggs, butter, and full-fat milk—things that our national dietary recommendations told us to decrease. Mysteriously, what didn’t seem to increase much—or at all—were SoFAS (meaning “Solid Fats and Added Sugars”) which, as far as the 2010 Dietary Guidelines for Americans are concerned, are the primary culprits behind our current health crisis. (“Solid Fats” are a linguistic sleight-of-hand that lumps saturated fat from natural animal sources in with processed partially-hydrogenated vegetables oils and margarines that contain transfats; SoFAS takes the trick a step further, by being not only a dreadful acronym in terms of implying that poor health is caused by sitting on our “sofas,” but by creating an umbrella term for foods that have little in common in terms of structure, biological function or nutrition.)

Around the late 70s or early 80s, there were sudden and rapid changes in America’s food supply and food choices and similar sudden and rapid changes in our health. How these two phenomena are related remains a matter of debate. It doesn’t matter if you’re Marion Nestle and you think the problem is calories or if you’re Gary Taubes and you think the problem is carbohydrate—both of those things increased in our food supply. (Whether or not the problem is fat is an open debate; food availability data points to an increase in added fats and oil, the majority of which are, ironically enough, the “healthy” monounsaturated kind; consumption data points to a leveling off of overall fat intake and a decrease in saturated fat—not a discrepancy I can solve here.) What seems to continue to mystify people is why this changed occurred so rapidly at this specific point in our food and health history.

Personally responsible or helplessly victimized?

At one time, it was commonly thought that obesity was a matter of personal responsibility and that our collective sense of willpower took a nosedive in the 80s, but nobody could ever explain quite why. (Perhaps a giant funk swept over the nation after The Muppet Show got cancelled, and we all collectively decided to console ourselves with Little Debbie Snack Cakes and Nickelodeon?) But because this approach is essentially industry-friendly (Hey, says Big Food, we just make the stuff!) and because no one has any explanation for why nearly three-quarters of our population decided to become fat lazy gluttons all at once (my Muppet Show theory notwithstanding) or for the increase of obesity among preschool children (clearly not affected by the Muppet Show’s cancellation), public health pundits and media-appointed experts have decided that obesity is no longer a matter of personal responsibility. Instead the problem is our “obesogenic environment,” created by the Big Bad Fast Processed Fatty Salty Sugary Food Industry.

Even though it is usually understood that a balance between supply and demand creates what happens in the marketplace, Michael Pollan has argued that it is the food industry’s creation of cheap, highly-processed, nutritionally-bogus food that has caused the rapid rise in obesity. If you are a fan of Pollanomics, it seems obvious that food industry—on a whim?—made a bunch of cheap tasty food, laden with fatsugarsalt, hoping that Americans would come along and eat it. And whaddaya know? They did! Sort of like a Field of Dreams only with Taco-flavored Doritos.

As a result, obesity has become a major public health problem.

Just like it was in 1952.

Helen Lee in thought-provoking article, The Making of the Obesity Epidemic (it is even longer than one of my blog posts, but well worth the time) describes how our obesity problem looked then:

“It is clear that weight control is a major public health problem,” Dr. Lester Breslow, a leading researcher, warned at the annual meeting of the western branch of the American Public Health Association (APHA).
 At the national meeting of the APHA later that year, experts called obesity “America’s No. 1 health problem.”

The year was 1952. There was exactly one McDonald’s in all of America, an entire six-pack of Coca-Cola contained fewer ounces of soda than a single Super Big Gulp today, and less than 10 percent of the population was obese.

In the three decades that followed, the number of McDonald’s restaurants would rise to nearly 8,000 in 32 countries around the world,
sales of soda pop and junk food would explode — and yet, against the fears and predictions of public health experts, obesity in the United States hardly budged. The adult obesity rate was 13.4 percent in 1960. In 1980, it was 15 percent. If fast food was making us fatter, it wasn’t by very much.

Then, somewhat inexplicably, obesity took off.”

It is this “somewhat inexplicably” that has me awake at night gnashing my teeth.

And what is Government going to do about it?

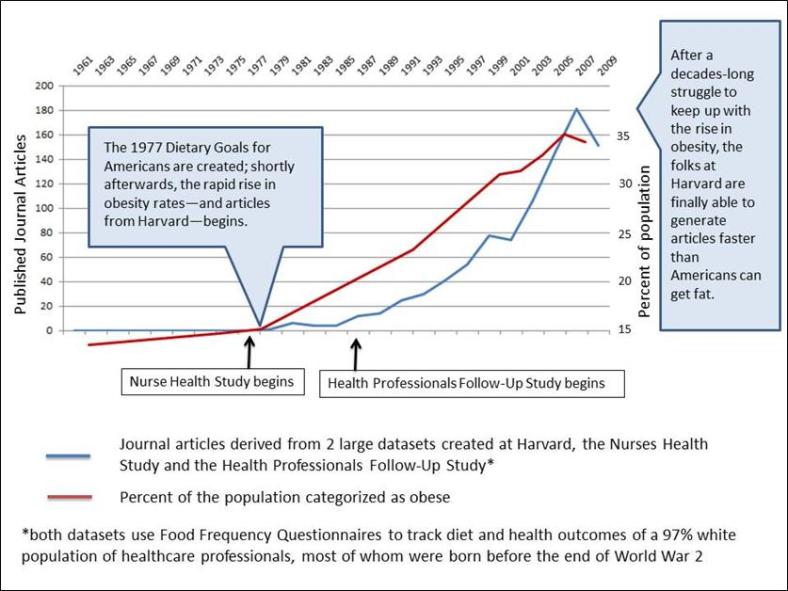
I wonder how “inexplicable” it would be to Ms. Lee had she put these two things together:

(In case certain peoples have trouble with this concept, I’ll type this very slowly and loudly: I’m not implying that the Dietary Guidelines “caused” the rise in obesity; I am merely illustrating a temporal relationship of interest to me, and perhaps to a few billion other folks. I am also not implying that a particular change in diet “caused” the rise in obesity. My focus is on the widespread and encompassing effects that may have resulted from creating one official definition of “healthy food choices to prevent chronic disease” for the entire population.)

Right now we are hearing calls from every corner for the government to create or reform policies that will reign in industry and “slim down the nation.” Because we’d never tried that before, right?

When smoking was seen as a threat to the health of Americans, the government issued a definitive report outlining the science that found a connection between smoking and risk of chronic disease. Although there are still conspiracy theorists that believe that this has all been a Big Plot to foil the poor widdle tobacco companies, in general, the science was fairly straightforward. Cigarette smoking—amount and duration—is relatively easy to measure, and the associations between smoking and both disease and increased mortality were compelling and large enough that it was difficult to attribute them to methodological flaws.

Notice that Americans didn’t wait around for the tobacco industry to get slapped upside the head by the FDA’s David Kessler in the 1990s. Tobacco use plateaued in the 1950s as scientists began to publicize reports linking smoking and cancer. The decline in smoking in America began in earnest with the release of Smoking and Health: Report of the Advisory Committee to the Surgeon General in 1964. A public health campaign followed that shifted social norms away from considering smoking as an acceptable behavior, and smoking saw its biggest declines before litigation and sanctions against Big Tobacco  happened in the 1990s.

Been there, done that, failed miserably.

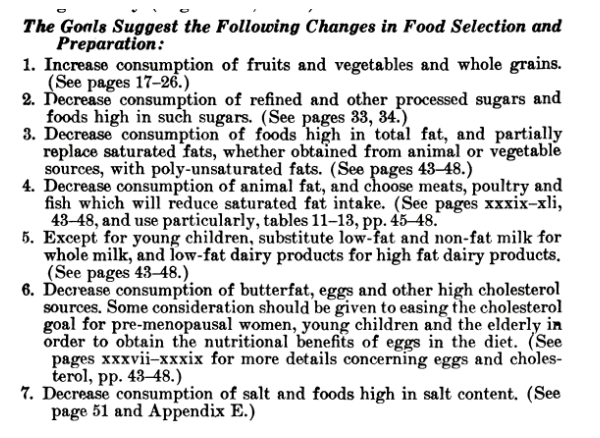
In a similar fashion, the 1977 Dietary Goals were the culmination of concerns about obesity that had begun decades before, joined by concerns about heart disease voiced by a vocal minority of scientists led by Ancel Keys. Declines in red meat, butter, whole milk and egg consumption had already begun in response to fears about cholesterol and saturated fat that originated with Keys and the American Heart Association—which used fear of fat and the heart attacks they supposedly caused as a fundraising tactic, especially among businessmen and health professionals, whom they portrayed as especially susceptible to this disease of “successful civilization and high living.”  The escalation of these fears—and declines in intake of animal foods portrayed as especially dangerous—picked up momentum when Senator George McGovern and his Select Senate Committee created the 1977 Dietary Goals for Americans. It was thought that, just as we had “tackled” smoking, we could create a document advising Americans on healthy food choices and compliance would follow. But issue was a lot less straightforward.

To begin with, when smoking was at its peak, only around 40% of the population smoked. On the other hand, we expect that approximately 100% of the population eats.

In addition, the anti-smoking campaigns of the 1960s and 1970s built on a long tradition of public health messages—originating with the Temperance movement—that associated smoking with dirty habits, loose living, and moral decay. It was going to be much harder to fully convince Americans that traditional foods typically associated with robust good health, foods that the US government thought were so nutritionally important that in the recent past they had been “saved” for the troops, were now suspect and to be avoided.

Where the American public had once been told to save “wheat, meat, and fats” for the soldiers, they now had to be convinced to separate the “wheat” from the “meat and fats” and believe that one was okay and the others were not.

To do this, public health leaders and policy makers turned to science, hoping to use it just as it had been used in anti-smoking arguments. Frankly, however, nutrition science just wasn’t up to the task. Linking nutrition to chronic disease was a field of study that would be in its infancy after it grew up a bit; in 1977, it was barely embryonic. There was little definitive data to support the notion that saturated fat from whole animal foods was actually a health risk; even experts who thought that the theory that saturated fat might be linked to heart disease had merit didn’t think there was enough evidence to call for dramatic changes in American’s eating habits.

The scientists who were intent on waving the “fear of fat” flag had to rely on observational studies of populations (considered then and now to be the weakest form of evidence), in order to attempt to prove that heart disease was related to intake of saturated fat (upon closer examination, these studies did not even do that).

Nutrition epidemiology is a soft science, so soft that it is not difficult to shape it into whatever conclusions the Consistent Public Health Message requires. In large-scale observational studies, dietary habits are difficult to measure and the results of Food Frequency Questionnaires are often more a product of wishful thinking than of reality. Furthermore, the size of associations in nutrition epidemiological studies is typically small—an order of magnitude smaller than those found for smoking and risk of chronic disease.

But nutrition epidemiology had proved its utility in convincing the public of the benefits of dietary change in the 70s and since then has become the primary tool—and the biggest funding stream (this is hardly coincidental)—for cementing in place the Consistent Public Health Message to reduce saturated fat and increase grains and cereals.

There is no doubt that the dramatic dietary change that the federal government was recommending was going to require some changes from the food industry, and they appear to have responded to the increased demands for low-fat,whole grain products with enthusiasm. Public health recommendations and the food fears they engendered are (as my friend James Woodward puts it) “a mechanism for encouraging consumers to make healthy eating decisions, with the ultimate goal of improving health outcomes.” Experts like Kelly Brownell and Marion Nestle decry the tactics used by the food industry of taking food components thought to be “bad” out of products while adding in components thought to be “good,” but it was federal dietary recommendations focusing above all else on avoiding saturated fat, cholesterol, and salt that led the way for such products to be marketed as “healthy” and to become acceptable to a confused, busy, and anxious public. The result was a decrease in demand for red meat, butter, whole milk and egg, and an increase in demand for low-saturated fat, low-cholesterol, and “whole” grain products. Minimally-processed animal-based products were replaced by cheaply-made, highly-processed plant-based products, which food manufacturers could market as healthy because, according to our USDA/HHS Dietary Guidelines, they were healthy.

The problem lies in the fact that—although these products contained less of the “unhealthy” stuff Americans were supposed to avoid—they also contained less of our most important nutrients, especially protein and fat-soluble vitamins. We were less likely to feel full and satisfied eating these products, and we were more likely to snack or binge—behaviors that were also fully endorsed by the food industry.

Between food industry marketing and the steady drumbeat of media messages explaining just how deadly red meat and eggs are (courtesy of population studies from Harvard, see above), Americans got the message. About 36% of the population believe that UFOs are real; only 25% believe that there’s no link between saturated fat and heart disease. We are more willing to believe that we’ve been visited by creatures from outer space than we are to believe that foods that humans have been eating ever since they became human have no harmful effects on health. But while industry has certainly taken advantage of our gullibility, they weren’t the ones who started those rumors, and they should not be shouldering all of the blame for the consequences.

Fixing it until it broke

Back in 1977, we were given a cure that didn’t work for diseases that we didn’t have. Then we spent billions in research dollars trying to get the glass slipper to fit the ugly stepsister’s foot. In the meantime, the food industry has done just what we would expect it to do, provide us with the foods that we think we should eat to be healthy and—when we feel deprived (because we are deprived)—with the foods we are hungry for.

We can blame industry, but as long as food manufacturers can take any mixture of vegetable oils and grain/cereals and tweak it with added fiber, vitamins, minerals, a little soy protein or maybe some chicken parts, some artificial sweeteners and salt substitutes, plus whatever other colors/preservatives/stabilizers/flavorizers they can get away with and still be able to get the right profile on the nutrition facts panel (which people do read), consumers–confused, busy, hungry–are going to be duped into believing what they are purchasing is “healthy” because–in fact–the government has deemed it so. And when these consumers are hungry later—which they are very likely to be—and they exercise their rights as consumers rather than their willpower, who should we blame then?

There is no way around it. Our dietary recommendations are at the heart of the problem they were created to try to reverse. Unlike the public health approach to smoking, we “fixed” obesity until it broke for real.

As the Calories Churn (Episode 2): Honey, It’s Not the Sugar

In the previous episode of As the Calories Churn, we looked at why it doesn’t really make sense to compare the carbohydrate intake of Americans in 1909 to the carbohydrate intake of Americans in 1997.  [The folks who read my blog, who always seem to be a lot smarter than me, have pointed out that, besides not being able to determine differing levels of waste and major environmental impacts such as a pre- or early-industrial labor force and transportation, there would also be significant differences in:  distribution and availability; what was acquired from hunted/home-grown foods; what came through the markets and ended up as animal rather than human feed; what other ingredients these carbohydrates would be packaged and processed with; and many other issues.  So in other words, we not comparing apples and oranges; we are comparing apples and Apple Jacks (TM).]

America in 1909 was very different from America in 1997, but America in 1970 was not so much, certainly with regard to some of the issues above that readers have raised.  By 1970, we had begun to settle into post-industrial America, with TVs in most homes and cars in most driveways.  We had a wide variety of highly-processed foods that were distributed through a massive transportation infrastructure throughout the country.

Beginning in the mid-1960s, availability of calories in the food supply, specifically from carbohydrates and fats had begun to creep up.  So did obesity.  It makes sense that this would be cause for concern from public health professionals and policymakers, who saw a looming health crisis ahead if measures weren’t taken–although others contended that our food supply was safer and more nutritious than it had ever been and that public health efforts should be focused on reducing smoking and environmental pollutants.

What emerged from the political and scientific tug-of-war that ensued (a story for another blog post) were the 1977 Dietary Goals for Americans.  These goals told us to eat more grains, cereals and vegetable oils and less fat, especially saturated fat.

Then, around 1977 – 1980, in other words around the time of the creation of the USDA’s recommendations to increase our intake of grains and cereals (both carbohydrate foods) and to decrease our intake of fatty foods, we saw the slope of availability of carbohydrate calories increase dramatically, while the slope of fat calories flattened–at least until the end of the 1990s (another story for another blog post).

[From food availability data, not adjusted for losses.]

The question is:  How did the changes in our food supply relate to the national dietary recommendations we were given in 1977?  Let’s take a closer look at the data that we have to work with on this question.

Dear astute and intelligent readers: From this point on, I am primarily using loss-adjusted food availability data rather than food availability data. Why? Because it is there, and it is a better estimate of actual consumption than unadjusted food availability data. It only goes back to around 1970, so you can’t use it for century-spanning comparisons, but if you are trying to do that, you’ve probably got another agenda besides improving estimation anyway. [If the following information makes you want to go back and make fun of my use of unadjusted food availability data in the previous post, go right ahead. In case you didn’t catch it, I think it is problematic to the point of absurdity to compare food availability data from the early 1900s to our current food system—too many changes and too many unknowns (see above).  On the other hand, while there are some differences, I think there are enough similarities in lifestyle and environment (apart from food) between 1970 and 2010 to make a better case for changes in diet and health being related to things apart from those influences.]

Here are the differences in types of food availability data: 

Food availability data: Food availability data measure the use of basic commodities, such as wheat, beef, and shell eggs for food products at the farm level or an early stage of processing. They do not measure food use of highly processed foods– –in their finished form. Highly processed foods–such as bakery products, frozen dinners, and soups—are not measured directly, but the data includes their less processed ingredients, such as sugar, flour, fresh vegetables, and fresh meat.

Loss-Adjusted Food Availability: Because food availability data do not account for all spoilage and waste that accumulates in the marketing system and is discarded in the home, the data typically overstate actual consumption. Food availability is adjusted for food loss, including spoilage, inedible components (such as bones in meat and pits in fruit), plate waste, and use as pet food.

The USDA likes to use unadjusted food availability data and call it “consumption” because, well: They CAN and who is going to stop them?

The USDA—and some bloggers too, I think—prefer unadjusted food availability data.  I guess they have decided that if American food manufacturers make it, then Americans MUST be eating it, loss-adjustments be damned. Our gluttony must somehow overcome our laziness, at least temporarily, as we dig the rejects and discards out of the landfills and pet dishes—how else could we get so darn fat?

I do understand the reluctance to use dietary intake data collected by NHANES, as all dietary intake data can be unreliable and problematic  (and not just the kind collected from fat people).  But I guess maybe if you’ve decided that Americans are being “highly inaccurate” about what they eat, then you figure it is okay be “highly inaccurate” right back at Americans about what you’ve decided to tell them about what they eat.  Because using food availability data and calling it “consumption” is to put it mildly, highly inaccurate, by a current difference of over 1000 calories.

On the other hand, it does sound waaaaaay more dramatic to say that Americans consumed 152 POUNDS (if only I could capitalize numbers!) per person of added sweeteners in 2000 (as it does here), than it does to say that we consumed 88 pounds per person that year (which is the loss-adjusted amount). Especially if you are intent on blaming the obesity crisis on sugar.

Which is kinda hard to do looking at the chart below.

Loss adjusted food availability:

Calories per day 1970 2010
Total 2076 2534 +458
Added fats and oils 338 562 +224
Flour and cereal products 429 596 +167
Poultry 75 158 +83
Added sugars and sweeteners 333 367 +34
Fruit 65 82 +17
Fish 12 14 +2
Butter 29 26 -3
Veggies 131 126 -5
Eggs 43 34 -9
Dairy 245 232 -13
Red meat* 349 267 -82
Plain whole milk 112 24 -88

*Red meat: beef, veal, pork, lamb

Anybody who thinks we did not change our diet dramatically between 1970 and the present either can’t read a dataset or is living in a special room with very soft bouncy walls. Why we changed our diet is still a matter of debate. Now, it is my working theory that the changes that you see above were precipitated, at least in part, by the advice given in the 1977 Dietary Goals for Americans, which was later institutionalized, despite all kinds of science and arguments to the contrary, as the first Dietary Guidelines for Americans in 1980.

Let’s see if my theory makes sense in light of the loss-adjusted food availability data above (and which I will loosely refer to as “consumption”).  The 1977 [2nd Edition] Dietary Goals for Americans say this:

#1 – Did we increase our consumption of grains? Yes. Whole? Maybe not so much, but our consumption of fiber went from 19 g per day in 1970 to 25 g per day in 2006 which is not much less than the 29 grams of fiber per day that we were consuming back in 1909 (this is from food availability data, not adjusted for loss, because it’s the only data that goes back to 1909).

The fruits and veggies question is a little more complicated. Availability data (adjusted for losses) suggests that veggie consumption went up about 12 pounds per person per year (sounds good, but that’s a little more than a whopping half an ounce a day), but that calories from veggies went down. Howzat? Apparently Americans were choosing less caloric veggies, and since reducing calories was part of the basic idea for insisting that we eat more of them, hooray on us. Our fruit intake went up by about an ounce a day; calories from fruit reflects that. So, while we didn’t increase our vegetable and fruit intake much, we did increase it. And just FYI, that minuscule improvement in veggie consumption didn’t come from potatoes. Combining fresh and frozen potato availability (adjusted for losses), our potato consumption declined ever so slightly.

#2 – Did we decrease our consumption of refined sweeteners? No. But we did not increase our consumption as much as some folks would like you to think. Teaspoons of added (caloric) sweeteners per person in our food supply (adjusted for waste) went from 21 in 1970 to 23 in 2010.  It is very possible that some people were consuming more sweeteners than other people since those numbers are population averages, but the math doesn’t work out so well if we are trying to blame added sweeteners for 2/3 of the population gaining weight.  It doesn’t matter how much you squint at the data to make it go all fuzzy, the numbers pretty much say that the amount of sweeteners in our food supply has not dramatically increased.

#3 – Did we decrease our consumption of total fat? Maybe, maybe not—depends on who you want to believe. According to dietary intake data (from our national food monitoring data, NHANES), in aggregate, we increased calories overall, specifically from carbohydrate food, and decreased calories from fat and protein. That’s not what our food supply data indicate above, but there you go.

Change in amount and type of calories consumed from 1971 to 2008
according to dietary intake data

There is general agreement , however, from both food availability data  and from intake data, that we decreased our consumption of the saturated fats that naturally occur with red meat, eggs, butter, and full-fat milk (see below), and we increased our consumption of “added fats and oils,” a category that consists almost exclusively of vegetable oils, which are predominantly polyunsaturated and which were added to foods–hence the category title–such as those inexpensive staples, grains and cereals, during processing.

#4 – Did we decrease our consumption of animal fat, and choose “meat, poultry, and fish which will reduce saturated fat intake”? Why yes, yes we did. Calories from red meat—the bearer of the dreaded saturated fat and all the curses that accompany it—declined in our food system, while poultry calories went up.

(So, I have just one itty-bitty request: Can we stop blaming the rise in obesity rates on burgers? Chicken nuggets, yes. KFC, yes. The buns the burgers come on, maybe. The fries, quite possibly. But not the burgers, because burgers are “red meat” and there was less red meat—specifically less beef—in our food supply to eat.)

Michael Pollan–ever the investigative journalist–insists that after 1977, “Meat consumption actually climbed” and that “We just heaped a bunch more carbs onto our plates, obscuring perhaps, but not replacing, the expanding chunk of animal protein squatting in the center.”   In the face of such a concrete and well-proven assumption, why bother even  looking at food supply data, which indicate that our protein from meat, poultry, fish, and eggs  “climbed” by just half an ounce?

In fact, there’s a fairly convenient balance between the calories from red meat that left the supply chain and the calories of chicken that replaced them. It seems we tried to get our animal protein from the sources that the Dietary Goals said were “healthier” for us.

#5 – Did we reduce our consumption of full-fat milk? Yes. And for those folks who contend this means we just started eating more cheese, well, it seems that’s pretty much what we did. However, overall decreases in milk consumption meant that overall calories from dairy fat went down.

#6 – Did we reduce our consumption of foods high in cholesterol? Yes, we did that too. Egg consumption had been declining since the relative affluence of post-war America made meat more affordable and as cholesterol fears began percolating through the scientific and medical community, but it continued to decline after the 1977 Goals.

#7 – Salt? No, we really haven’t changed our salt consumption much and perhaps that’s a good thing. But the connections between salt, calorie intake, and obesity are speculative at best and I’m not going to get into them here (although I do kinda get into them over here).

food supply and Dietary GoalsWhat I see when I look at the data is a good faith effort on the part of the American people to try to consume more of the foods they were told were “healthy,” such as grains and cereals, lean meat, and vegetable oils. We also tried to avoid the foods that we were told contained saturated fat—red meat, eggs, butter, full-fat milk—as these foods had been designated as particularly “unhealthy.” No, we didn’t reduce our sweetener consumption, but grains and cereals have added nearly 5 times more calories than sweeteners have to our food supply/intake.

Although the America of 1970 is more like the America of today than the America of 1909, some things have changed. Probably the most dramatic change between the America of the 1970s and the America of today is our food-health system. Women in the workplace, more suburban sprawl, changing demographics, increases in TV and other screen time—those were all changes that had been in the works for a long time before the 1977 Dietary Goals came along. But the idea that meat and eggs were “bad” for you? That was revolutionary.

And the rapid rises in obesity and chronic diseases that accompanied these changes? Those were pretty revolutionary as well.

One of my favorite things to luck upon on a Saturday morning in the 70s—aside from the Bugs Bunny-does-Wagner cartoon, “What’s Opera, Doc?“—were the public service announcements featuring Timer, an amorphous yellow blob with some sing-along information about nutrition:

You are what you eat

From your head down to your feet

Thinks like meat and eggs and fish you

Need to build up muscle tissue

Hello appetite control?

More protein!

Meat and eggs weren’t bad for you. They didn’t cause heart disease. You needed them to build up muscle tissue and to keep you from being hungry!

But in 1984, when this showed up on the cover of Time magazine (no relation to Timer the amorphous blob), I—along with a lot of other Americans—was forced to reconsider what I’d learned on those Saturday morning not that long ago:

My all-time favorite Timer PSA was this one:

When my get up and go has got up and went,

I hanker for a hunk of cheese.

When I’m dancing a hoedown

And my boots kinda slow down,

Or any time I’m weak in the knees . . .

I hanker for a hunk of

A slab or slice or chunk of–

A snack that is a winner

And yet won’t spoil my dinner–

I hanker for hunk of CHEESE!

In the 80s, when I took up my low-fat, vegetarian ways, I would still hanker for a hunk of cheese, but now I would look for low-fat, skim, or fat-free versions—or feel guilty about indulging in the full-fat versions that I still loved.

I’m no apologist for the food industry; such a dramatic change in our notions about “healthy food” clearly required some help from them, and they appear to have provided it in abundance.  And I’m not a fan of sugar-sweetened beverages or added sweeteners in general, but dumping the blame for our current health crisis primarily on caloric sweeteners is not only not supported by the data at hand, it frames the conversation in a way that works to the advantage of the food industry and gives our public health officials a “get out of jail free card”  for providing 35 years worth of lousy dietary guidance.

Next time on As the Calorie Churns, we’ll explore some of the interaction between consumers, industry, and public health nutrition recommendations. Stay tuned for the next episode, when you’ll get to hear Adele say: “Pollanomics: An approach to food economics that is sort of like the Field of Dreams—only with taco-flavored Doritos.”

As the Calories Churn (Episode 1): Nooooo, not the carbs!!!

Oh the drama!  Some of the current hyperventilating in the alternative nutrition community–sugar is toxic, insulin is evil, vegetable oils give you cancer, and running will kill you–has, much to my dismay, made the alternative nutrition community sound as shrill and crazed as the mainstream nutrition one.

When you have self-appointed nutrition experts food writers like Mark Bittman agreeing feverishly with a pediatric endocrinologist with years of clinical experience like Robert Lustig, we’ve crossed over into some weird nutrition Twilight Zone where fact, fantasy, and hype all swirl together in one giant twitter feed of incoherence meant, I think, to send us into a dark corner where we can do nothing but nibble on organic kale, mumble incoherently about inflammation and phytates, and await the zombie apocalypse.

No, carbohydrates are not evil—that’s right, not even sugar. If sugar were rat poison, one trip to the county fair in 4th grade would have killed me with a cotton candy overdose. Neither is insulin, now characterized as the serial killer of hormones (try explaining that to a person with type 1 diabetes).

But that doesn’t mean that 35 years of dietary advice to increase our grain and cereal consumption, while decreasing our fat and saturated fat consumption has been a good idea.

I have gotten rather tired of seeing this graph used as a central rationale for arguing that the changes in total carbohydrate intake over the past 30 years have not contributed to the rising rates of obesity.


The argument takes shapes on 2 fronts:

1) We ate 500 grams of carbohydrate per day in 1909 and 500 grams in 1997 and WE WEREN’T FAT IN 1909!

2) The other part of the argument is that the TYPE of carbohydrate has shifted over time. In 1909, we ate healthy, fiber-filled unrefined and unprocessed types of carbohydrates. Not like now.

Okay, let’s take closer look at that paper, shall we?  And then let’s look at what really matters:  the context.

The data used to make this graph are not consumption data, but food availability data. This is problematic in that it tells us how much of a nutrient was available in the food supply in any given year, but does not account for food waste, spoilage, and other losses. And in America, we currently waste a lot of food. 

According to the USDA, we currently lose over 1000 calories in our food supply–calories that don’t make it into our mouths.  Did we waste the same percentage of our food supply across the entire century? Truth is, we don’t know and we are not likely to find out—but I seriously doubt it. My mother and both my grandmothers—with memories of war and rationing fresh in their minds—would be no more likely to throw out anything remotely edible as they would be to do the Macarena. My mother has been known to put random bits of leftover food in soups, sloppy joes, and—famously—pancake batter. To this day, should your hand begin to move toward the compost bucket with a tablespoon of mashed potatoes scraped from the plate of a grandchild shedding cold virus like it was last week’s fashion, she will throw herself in front of the bucket and shriek, “NOOOOOO! Don’t throw that OUT! I’ll have that for lunch tomorrow.”

You know what this means folks: in 1909, we were likely eating MORE carbohydrate than we are today. (Or maybe in 1909, all those steelworkers pulling 12 hour days 7 days a week, just tossed out their sandwich crusts rather than eat them. It could happen.)

BUT–as with butts all over America including mine, it’s a really Big BUT: How do I explain the fact that Americans were eating GIANT STEAMING HEAPS OF CARBOHYDRATES back in 1909—and yet, and yet—they were NOT FAT!!??!!

Okay. Y’know. I’m up for this one. Not only is problematic to the point of absurdity to compare food availability data from the early 1900s to our current food system, life in general was a little different back then. At the turn of the century,

  • average life expectancy was around 50
  • the nation had 8,000 cars
  • and about 10 miles of paved roads.

In 1909, neither assembly lines nor the Titanic had happened yet.

The labor force looked a little different too:Labor force 1900 - 2000

Primary occupations made up the largest percentage of male workers (42%)—farmers, fisherman, miners, etc.—what we would now call manual laborers. Another 21% were “blue collar” jobs, craftsmen, machine operators, and laborers whose activities in those early days of the Industrial Revolution, before many things became mechanized, must have required a considerable amount of energy. And not only was the work hard, there was a lot of it. At the turn of the century, the average workweek was 59 hours, or close to 6 10-hour days. And it wasn’t just men working. As our country shifted from a rural agrarian economy to a more urban industrialized one, women and children worked both on the farms and in the factories.

This is what is called “context.”

In the past, nutrition epidemiologists have always considered caloric intake to be a surrogate marker for activity level. To quote Walter Willett himself:

“Indeed, in most instances total energy intake can be interpreted as a crude measure of physical activity . . . ” (in: Willett, Walter. Nutritional Epidemiology. Oxford University Press, 1998, p. 276).

It makes perfect sense that Americans would have a lot of carbohydrate and calories in their food supply in 1909. Carbohydrates have been—and still are—a cheap source of energy to fuel the working masses. But it makes little sense to compare the carbohydrate intake of the labor force of 1909 to the labor force of 1997, as in the graph at the beginning of this post (remember the beginning of this post?).

After decades of decline, carbohydrate availability experienced a little upturn from the mid 1960s to the late 1970s, when it began to climb rapidly. But generally speaking, carbohydrate intake was lower during that time than at any point previously.

I’m not crazy about food availability data, but to be consistent with the graph at the top of the page, here it is.

Data based on per capita quantities of food available for consumption:

1909 1975 Change
Total calories 3500 3100 -400
Carbohydrate calories 2008 1592 -416
Protein calories 404 372 -32
Total fat calories 1098 1260 +162
Saturated fat (grams) 52 47 -5
Mono- and polyunsaturated fat (grams) 540 738 +198
Fiber (grams) 29 20 -9

To me, it looks pretty much like it should with regard to context.  As our country went from pre- and early industrialized conditions to a fully-industrialized country of suburbs and station wagons, we were less active in 1970 than we were in 1909, so we consumed fewer calories. The calories we gave up were ones from the cheap sources of energy—carbohydrates—that would have been most readily available in the economy of a still-developing nation. Instead, we ate more fat.

We can’t separate out “added fats” from “naturally-present fats” from this data, but if we use saturated fat vs. mono- and polyunsaturated fats as proxies for animal fats vs. vegetable oils (yes, I know that animal fats have lots of mono- and polyunsaturated fats, but alas, such are the limitations of the dataset), then it looks like Americans were making use of the soybean oil that was beginning to be manufactured in abundance during the 1950s and 1960s and was making its way into our food supply.  (During this time, heart disease mortality was decreasing, an effect likely due more to warnings about the hazards of smoking, which began in earnest in 1964, than to dietary changes; although availability of unsaturated fats went up, that of saturated fats did not really go down.)

As for all those “healthy” carbohydrates that we were eating before we started getting fat? Using fiber as a proxy for level of “refinement” (as in the graph at the beginning of this post—remember the beginning of this post?), we seemed to be eating more refined carbohydrates in 1975 than in 1909—and yet, the obesity crisis was still yet a gleam in Walter Willett’s eyes.

While our lives in 1909 differed greatly from our current environment, our lives in the 1970s were not all that much different than they are now. I remember. As much as it pains me to confess this, I was there. I wore bell bottoms. I had a bike with a banana seat (used primarily for trips to the candy store to buy Pixie Straws). I did macramé. My parents had desk jobs, as did most adults I knew. No adult I knew “exercised” until we got new neighbors next door. I remember the first time our new next-door neighbor jogged around the block. My brothers and sister and I plastered our faces to the picture window in the living room to scream with excitement every time she ran by; it was no less bizarre than watching a bear ride a unicycle.

In 1970, more men had white-collar than blue-collar jobs; jobs that primarily consisted of manual labor had reached their nadir. Children were largely excluded from the labor force, and women, like men, had moved from farm and factory jobs to more white (or pink) collar work. The data on this is not great (in the 1970s, we hadn’t gotten that excited about exercise yet) but our best approximation is that about 35% of adults–one of whom was my neighbor–exercised regularly, with “regularly” defined as “20 minutes at least 3 days a week” of moderately intense exercise.  (Compare this definition, a total of 60 minutes a week, to the current recommendation, more than double that amount, of 150 minutes a week.)

Not too long ago, the 2000 Dietary Guidelines Advisory Committee (DGAC) recognized that environmental context—such as the difference between America in 1909 and America in 1970—might lead to or warrant dietary differences:

“There has been a long-standing belief among experts in nutrition that low-fat diets are most conducive to overall health. This belief is based on epidemiological evidence that countries in which very low fat diets are consumed have a relatively low prevalence of coronary heart disease, obesity, and some forms of cancer. For example, low rates of coronary heart disease have been observed in parts of the Far East where intakes of fat traditionally have been very low. However, populations in these countries tend to be rural, consume a limited variety of food, and have a high energy expenditure from manual labor. Therefore, the specific contribution of low-fat diets to low rates of chronic disease remains uncertain. Particularly germane is the question of whether a low-fat diet would benefit the American population, which is largely urban and sedentary and has a wide choice of foods.” [emphasis mine – although whether our population in 2000 was largely “sedentary” is arguable]

The 2000 DGAC goes on to say:

“The metabolic changes that accompany a marked reduction in fat intake could predispose to coronary heart disease and type 2 diabetes mellitus. For example, reducing the percentage of dietary fat to 20 percent of calories can induce a serum lipoprotein pattern called atherogenic dyslipidemia, which is characterized by elevated triglycerides, small-dense LDL, and low high-density lipoproteins (HDL). This lipoprotein pattern apparently predisposes to coronary heart disease. This blood lipid response to a high-carbohydrate diet was observed earlier and has been confirmed repeatedly. Consumption of high-carbohydrate diets also can produce an enhanced post-prandial response in glucose and insulin concentrations. In persons with insulin resistance, this response could predispose to type 2 diabetes mellitus.

The committee further held the concern that the previous priority given to a “low-fat intake” may lead people to believe that, as long as fat intake is low, the diet will be entirely healthful. This belief could engender an overconsumption of total calories in the form of carbohydrate, resulting in the adverse metabolic consequences of high carbohydrate diets. Further, the possibility that overconsumption of carbohydrate may contribute to obesity cannot be ignored. The committee noted reports that an increasing prevalence of obesity in the United States has corresponded roughly with an absolute increase in carbohydrate consumption.” [emphasis mine]

Hmmmm. Okay, folks, that was in 2000—THIRTEEN years ago. If the DGAC was concerned about increases in carbohydrate intake—absolute carbohydrate intake, not just sugars, but sugars and starches—13 years ago, how come nothing has changed in our federal nutrition policy since then?

I’m not going to blame you if your eyes glaze over during this next part, as I get down and geeky on you with some Dietary Guidelines backstory:

As with all versions of the Dietary Guidelines after 1980, the 2000 edition was based on a report submitted by the DGAC which indicated what changes should be made from the previous version of the Guidelines. And, as will all previous versions after 1980, the changes in the 2000 Dietary Guidelines were taken almost word-for-word from the suggestions given by the scientists on the DGAC, with few changes made by USDA or HHS staff. Although HHS and USDA took turns administrating the creation of the Guidelines, in 2000, no staff members from either agency were indicated as contributing to the writing of the final Guidelines.

But after those comments in 2000 about carbohydrates, things changed.

Beginning with the 2005 Dietary Guidelines, HHS and USDA staff members are in charge of writing the Guidelines, which are no longer considered to be a scientific document whose audience is the American public, but a policy document whose audience is nutrition educators, health professionals, and policymakers. Why and under whose direction this change took place is unknown.

The Dietary Guidelines process doesn’t have a lot of law holding it up. Most of what happens in regard to the Guidelines is a matter of bureaucracy, decision-making that takes place within USDA and HHS that is not handled by elected representatives but by government employees.

However, there is one mandate of importance: the National Nutrition Monitoring and Related Research Act of 1990, Public Law 445, 101st Cong., 2nd sess. (October 22, 1990), section 301. (P.L. 101-445) requires that “The information and guidelines contained in each report required under paragraph shall be based on the preponderance of the scientific and medical knowledge which is current at the time the report is prepared.”

The 2000 Dietary Guidelines were (at least theoretically) scientifically accurate because scientists were writing them. But beginning in 2005, the Dietary Guidelines document recognizes the contributions of an “Independent Scientific Review Panel who peer reviewed the recommendations of the document to ensure they were based on a preponderance of scientific evidence.” [To read the whole sordid story of the “Independent Scientific Review Panel,” which appears to neither be “independent” nor to “peer-review” the Guidelines, check out Healthy Nation Coalition’s Freedom of Information Act results.]  Long story short:  we don’t know who–if anyone–is making sure the Guidelines are based on a complete and current review of the science.

Did HHS and USDA not like the direction that it looked like the Guidelines were going to take–with all that crazy talk about too many carbohydrates – and therefore made sure the scientists on the DGAC were farther removed from the process of creating them?

Hmmmmm again.

Dr. Janet King, chairwoman of the 2005 DGAC had this to say, after her tenure creating the Guidelines was over: “Evidence has begun to accumulate suggesting that a lower intake of carbohydrate may be better for cardiovascular health.”

Dr. Joanne Slavin, a member of the 2010 DGAC had this to say, after her tenure creating the Guidelines was over: “I believe fat needs to go higher and carbs need to go down,” and “It is overall carbohydrate, not just sugar. Just to take sugar out is not going to have any impact on public health.”

It looks like, at least in 2005 and 2010, some well-respected scientists (respected well enough to make it onto the DGAC) thought that—in the context of our current environment—maybe our continuing advice to Americans to eat more carbohydrate and less fat wasn’t such a good idea.

I think it is at about this point that I begin to hear the wailing and gnashing of teeth of those who don’t think Americans ever followed this advice to begin with, because—goodness knows—if we had, we wouldn’t be so darn FAT!

So did Americans follow the advice handed out in those early dietary recommendations? Or did Solid Fats and Added Sugars (SoFAS—as the USDA/HHS like to call them—as in “get up offa yur SoFAS and work your fatty acids off”) made us the giant tubs of lard that we are just as the USDA/HHS says they did?

Stay tuned for the next episode of As the Calories Churn, when I attempt to settle those questions once and for all.  And you’ll hear a big yellow blob with stick legs named Timer say, “I hanker for a hunk of–a slab or slice or chunk of–I hanker for a hunk of cheese!”