Don’t look now, but I think the Institute of Medicine’s new report on sodium just bitch-slapped the USDA/HHS 2010 Dietary Guidelines.
In case you have a life outside of the nutritional recommendation roller derby, the IOM recently released a report that comes to the conclusion that restricting sodium intake to 1500 mg/day may increase rather than reduce health risks. Which is a little weird, since the 2010 Dietary Guidelines did a great job of insisting that any American with high blood pressure, all blacks, and every middle-aged and older adult—plus anyone who has ever eaten bacon or even thought about eating bacon, i.e. nearly everybody—should limit their salt intake to 1500 mg of sodium a day, or less than ¾ of a teaspoon of salt. The American Heart Association was, of course, aghast. The AHA thinks EVERYBODY should be limited to less than ¾ teaspoon of salt a day, including people who wouldn’t even think about thinking about bacon.
Why are the AHA and USDA/HHS so freaked out about salt? And how did the IOM reach such a vastly different conclusion than that promoted by the AHA and the Dietary Guidelines? Fasten your seat belts folks, it’s gonna be a bumpy blog.
First, it is helpful to examine why the folks at AHA and USDA/HHS are so down on salt. The truth: we have no freakin’ idea. Salt has been around since what, the dawn of civilization maybe? It is an essential nutrient, and it plays an important role in preserving food and preventing microbial growth (especially on bacon). But Americans could still be getting too much of a good thing. Everybody at the AHA seems to think that Americans consume “excessive amounts” of sodium. (Of course, just about anything looks excessive compared to less than ¾ of a teaspoon.) But do we really consume too much sodium?
Back in 2010, Dr. Laurence I-Know-More-About-Sodium-Than-Your-Kidneys-Do Appel (or as his friends call him, “Low-Sodium Larry”), one of the leading advocates for a salt-free universe, acknowledged that “The data is quite murky. We just don’t have great data on sodium trends over time. I wish that we did. But I can’t tell you if there’s been an increase or decrease.”
Well, Low-Sodium Larry, I can, and I am about to make your wish come true.
According to recent research done by that wild bunch of scientific renegades at Harvard, in the past 60 years sodium intake levels have . . .drumroll, please . . . not done much of anything.
Hey, that doesn’t sound right! Everyone knows that it is virtually impossible to get an accurate measure of sodium intake from dietary questionnaires; people are probably just “under-reporting” their salt intake like they “under-report” everything else. Low-Sodium Larry has previously insisted that one of the reasons the data is so murky is that few epidemiological studies measure sodium intake accurately and that, “really, you should do 24-hour urinary sodium excretions to do it right.”
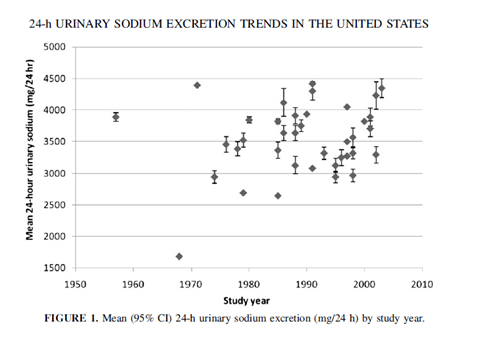
The guys at Harvard looked at studies that did it right. This systematic analysis of 38 studies from the 1950s to the present, found that 24-hour urinary sodium excretion (the “gold” standard—omg, I could not resist that—of dietary sodium intake estimation) has neither increased nor decreased, but has remained essential stable over time. Despite the fact that Americans are apparently hoovering up salt like Kim Kardashian hoovers up French fries—and with much the same results, i.e. puffing up like a Macy’s Thanksgiving Day balloon—for whatever reason we simply aren’t excreting more of it in our urine.
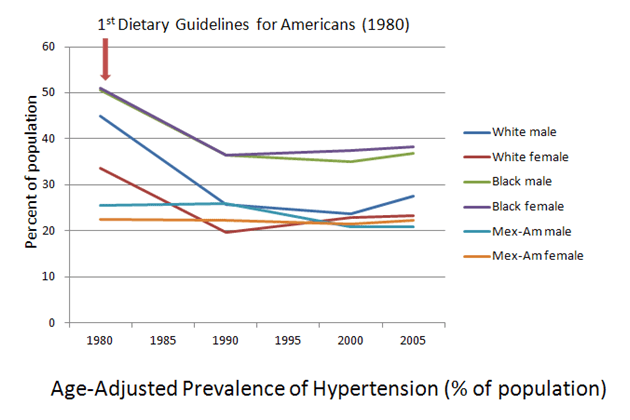
According to that same study however, despite the lack of increase in sodium excretion (which is supposed to accurately reflect intake—but that can’t be right), high blood pressure rates in the population have been increasing. Duh. Everyone knows that eating lots of salt makes your blood pressure go up. But have the rates of high blood pressure in America really been going up?

Age-Adjusted Prevalence of Hypertension (2009 NIH Chart Book)
Well, no. Not really. The Harvard dudes cite a report that goes back to 1988-1994 data, and yes, rates of high blood pressure have been creeping slowly back up since then. This is because from 1976-1980 to 1988-1994, rates of high blood pressure plummeted for most segments of the American population.
We don’t know why rates of high blood pressure fell during the 70s and early 80s. It may have been that the Dietary Guidelines told people to eat more potassium-filled veggies and people actually tried to follow the Dietary Guidelines, which would have had a positive effect on high blood pressure. On the other hand, it could have been largely due to the sedating influence of the soft rock music of that era blanketing the airwaves with the mellow tones of England Dan and John Ford Coley, Christopher Cross, Ambrosia, and the like (youtube it, you young whippersnappers out there). We also don’t know why rates are going back up. Rising rates of obesity may be part of the problem, but it is also entirely possible that piping the Monsters of Lite Rock through every PA system in the country might save our health care system a lot of time and trouble.
This is what we (think we) know:
- High-sodium diets might possibly maybe sometimes be a contributor to high blood pressure.
- Rates of high blood pressure are going (back) up.
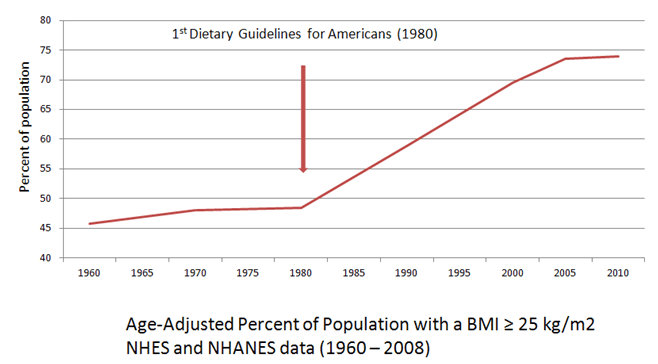
- Obesity rates are definitely going up.
Ergo pro facto summa cum laude, it is clear—using the logic that seems to undergird the vast majority of our public health nutrition recommendations—salt makes you fat. The USDA/HHS has been faced with rapidly rising rates of obesity which, until now, they have only been to pin on the laziness and gluttony of Americans. But if salt makes us fat, that might explain why the USDA/HHS doesn’t want us to eat it.
After all, the biomechanics of this is pretty straightforward. If you eat too much sodium (which we must be), but you don’t pee it out (which we aren’t), you must be retaining it and this is what makes your blood pressure and your weight both go way up. They didn’t really cover the physics of this in my biochemistry classes so you’ll have to ask Dr. Appel how this works because he knows more about sodium than your kidneys do. But I think it must be true. After all, this is the mechanism that explains the weight loss behind carbohydrate-reduced diets, right? I myself reduced my carb intake and lost 60 pounds of water weight!
And besides, taking the salt out of our food will give food manufacturers the opportunity to make food more expensive and tasteless while adding synthetic ingredients whose long-term effects are unknown—just what the American consumer wants!
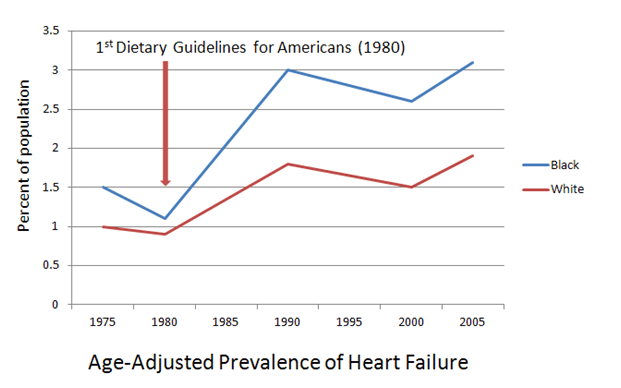
For a while there, we thought the whole idea was to reduce sodium in order to reduce blood pressure in order to reduce diseases of the circulatory system, like heart failure, stroke, and coronary heart disease . That didn’t seem to work out so well, because the whole time that sodium intake was staying stable (if we want to believe the urinary sodium excretion data) and high blood pressure rates were going down (although they are starting to go back up), rates of those diseases have gone up:

Age-Adjusted Prevalence of Heart Failure (2009 NIH Chart Book)

Age-Adjusted Prevalence of Stroke (2009 NIH Chart Book)

Age-Adjusted Prevalence of Coronary Heart Disease (2007 NIH Chart Book)
So if reducing blood pressure to reduce cardiovascular disease isn’t the answer, then we must need to reduce blood pressure to reduce obesity! By jove, I think we’ve got it!
The USDA/HHS must have known the “salt makes you fat” notion would be a tough sell, I mean, what with the lack of any shred of supporting science and all that. (But then, the “salt causes high blood pressure which causes cardiovascular disease” argument hasn’t exactly been overburdened by evidence either, and that never seemed to stop anyone.) So the 2010 Dietary Guidelines brought together the American Heart Association’s Superheroes of Sodium Slashing, Low-Sodium Larry and his bodacious salt-subduing sidekick, Linda Van Horn, both of whom had been preaching the gospel of sodium-reduction as a preventive health measure with little conclusive evidence to support their recommendations. The USDA/HHS knew that with Linda and Larry on the team, it didn’t matter how lame the science, how limited the data, or how ludicrous the recommendation, these two could be counted on to review any and all available evidence and reliably come up with the exact same concrete and well-proven assumptions they’d been coming up with for years.

The Sodium-Slashing Superheroes–Drs. Lawrence Appel and Linda Van Horn– ready to make the world safe for bland, unappetizing food everywhere! (Drawings courtesy of Butcher Billy)
So here’s the cliffhanger: Will Linda and Larry be able to torture the science on salt into confessing its true role in the obesity crisis?
Tune in tomorrow, when you’ll hear Linda and Larry say: “Science? We don’t need no stinkin’ science.”