Sodium-Slashing Superheroes Low-Sodium Larry and his bodacious side-kick Linda “The Less Salt the Better” Van Horn team up to protect Americans from the evils lurking in a teaspoon of salt!
(Drawings courtesy of Butcher Billy)
Yesterday, we found our Sodium-Slashing Superheroes Larry and Linda determined to make sure that no American endangered his/her health by ingesting more than ¾ of a teaspoon of salt a day. But recently, an Institute of Medicine report determined that recommendations to reduce sodium intake to such low levels provided no health benefits and could be detrimental to the health of some people. [In case you missed it and your job is really boring, you can read Part 1 of the NaCl Debacle here.]
Our story picks up as the 2010 USDA/HHS Dietary Guidelines Advisory Committee, fearlessly led by Linda and Larry, arrives at the foregone conclusion that most, if not all, US adults would (somehow) benefit from reducing their sodium intake to 1500 mg/day. The American Heart Association, in a report written by—surprise!—Larry and Linda, goes on to state that “The health benefits [of reducing sodium intake to 1500 mg/day] apply to Americans in all groups, and there is no compelling evidence to exempt special populations from this public health recommendation.”
Does that mean there is “compelling evidence” to include special populations, or for that matter ordinary populations, in this 1500 mg/day recommendation? No, but who cares?
Does that mean there is science to prove that “excess” sodium intake (i.e. more than ¾ of a teaspoon of salt a day) leads to high blood pressure and thus cardiovascular disease, or that salt makes you fat, or that sodium consumption will eventually lead to the zombie apocalypse? No, no, and no—but who cares?
Larry and Linda KNOW that salt is BAD. Science? They don’t need no stinkin’ science.
Because the one thing everyone seems to be able to agree on is that the science on salt does indeed stink. The IOM report has had to use many of the same methodologically-flawed studies available to the 2010 Dietary Guidelines Advisory Committee, full of the same confounding, measurement error, reverse causation and lame-ass dietary assessment that we know and love about all nutrition epidemiology studies. But the 2010 Dietary Guidelines Advisory Committee didn’t actually bother to look at these studies.
Why not? (And let me remind you that the Dietary Guidelines folks usually <heart> methodologically-flawed study designs, full of confounding, measurement error, reverse causation and lame-ass dietary assessment.)
First, a little lesson in how the USDA/HHS folks create dietary guidance meant to improve the health and well-being of the American people:
- Take a clinical marker, whose health implications are unclear, but whose levels we can measure cheaply and easily (like blood pressure, cholesterol, weight).
- Suggest that this marker—like Karnac the Magnificent—can somehow predict risk of a chronic disease whose origins are multiple and murky (like obesity, heart disease, cancer).
- Use this suggestion to establish some arbitrary clinical cut offs for when this marker is “good” and “bad.” (Note to public health advocacy organizations: Be sure to frequently move those goalposts in whichever direction requires more pharmaceuticals to be purchased from the companies that sponsor you.)
- Find some dietary factor that can easily and profitably be removed from our food supply, but whose intake is difficult to track (like saturated fat, sodium, calories).
- Implicate the chosen food factor in the regulation of the arbitrary marker, the details of which we don’t quite understand. (How? Use observational data—see methodological flaws above—but hunches and wild guesses will also work.)
- Create policy that insists that the entire population—including people who, by the way, are not (at least at this point) fat, sick or dead—attempt to prevent this chronic disease by avoiding this particular dietary factor. (Note to public health advocacy organizations: Be sure to offer food manufacturers the opportunity to have the food products from which they have removed the offensive component labeled with a special logo from your organization—for a “small administrative fee,” of course.)
- Commence collecting weak, inconclusive, and inconsistent data to prove that yes indeedy this dietary factor we can’t accurately measure does in fact have some relationship to this arbitrary clinical marker, whose regulation and health implications we don’t fully understand.
- Finally—here’s the kicker—measure the success of your intervention by whether or not people are willing to eat expensive, tasteless, chemical-filled food devoid of the chosen food factor in order to attempt to regulate the arbitrary clinical marker.
- Whatever you do, DO NOT EVER measure the success of your intervention by looking at whether or not attempts to follow your intervention has made people fat, sick, or dead in the process.
- Ooops. I think I just described the entire history of nutrition epidemiology of chronic disease.
Blood pressure is easy to measure, but we don’t always know what causes it to go up (or down). There is no real physiological difference between having a blood pressure reading of 120/80, which will get you a diagnosis of “pre-hypertension” and a fistful of prescriptions, and a reading of 119/79, which won’t. Blood pressure is not considered to be a “distinct underlying cause of death,” which means that, technically, no one ever dies of blood pressure (high or low). We certainly don’t know how to disentangle the effects of lowering dietary sodium on blood pressure from other effects (like weight loss) that may be related to dietary changes that are a part of an attempt to lower sodium (and we have an embarrassingly hard time collecting accurate dietary intake information from Food Fantasy Questionnaires anyway). We also know that individual response to sodium varies widely.
So doesn’t it make perfect sense that the folks at the USDA/HHS should ignore science that investigates the relationship between sodium intake and whether or not a person stayed out of the hospital, had a heart attack, or up and died? Well, it doesn’t to me, but nevertheless the USDA/HHS has remained obsessively fixated on one thing and one thing only, what effects reducing sodium has on blood pressure, and they pay not one whit of attention to what effects reducing sodium has on, say, aliveness.
So let’s just get this out there and agree to agree: reducing sodium in most cases will reduce blood pressure. But then, just to be clear, so will dismemberment, dysentery, and death. We can’t just assume that lowering sodium will only affect blood pressure or will only positively affect health (I mean, we can’t unless we are Larry or Linda). Recent research, which prompted the IOM review, indicates that reducing sodium will also increase triglyceride levels, insulin resistance, and sympathetic nervous system activity. For the record, clinicians generally don’t consider these to be good things.
This may sound radical but in their review of the evidence, the IOM committee decided to do a few things differently.
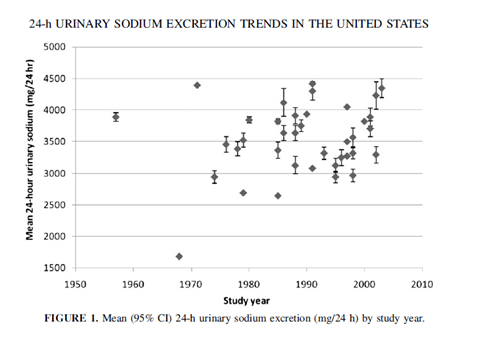
First, they gave more weight to studies that determined sodium intake levels through multiple high-quality 24-hour urine collections. Remember, this is Low-Sodium Larry’s favorite way of estimating intake.
Also, they did not approach the data with a predetermined “healthy” range already established in their brains. Because of the extreme variability in intake levels among population groups, they decided to—this is crazy, I know—let the outcomes speak for themselves.
Finally, and most importantly, in the new IOM report, the authors, unlike Larry and Linda, focused on—hold on to your hats, folks!—actual health outcomes, something the Dietary Guidelines Have. Never. Done. Ever.
The IOM committee found, in a nutshell:
In other words, there is no science to indicate that we all need to be consuming less than ¾ of a teaspoon of salt a day. Furthermore, while there may be some subpopulations that may benefit from sodium reduction, reducing sodium intake to 1500 mg/day may increase risk of adverse health outcomes for people with congestive heart failure, diabetes, chronic kidney disease, or heart disease. (If you’d like to wallow in some of the studies reviewed by the IOM, I’ve provided the Reader’s Digest Condensed Version at the bottom of the page.)
Of course, the American Heart Association, eager to provide the public with the most up-to-date recommendations about heart health as long as they don’t contradict outdated recommendations of which the AHA is fond, responded to the IOM report by saying, “The American Heart Association is not changing its position. The association rejects the Institute of Medicine’s conclusions because the studies on which they were based had methodological flaws.”
Um, hello AHA? Exactly what completely non-existent, massive, highly-controlled and yet highly-generalizable randomized controlled trials about sodium intake and health effects were you planning on using to make your case? I believe it was the AHA that mentioned that “It is well-known, however, that such trials are not feasible because of logistic, financial, and often ethical considerations.” Besides, I don’t know what the AHA is whining about. The quality of the science hardly matters if you are not going to pay any attention to it in the first place.
No, folks that giant smacking sound you hear is not my head on my keyboard. That was the sound of science crashing into a giant wall of Consistent Public Health Message. Apparently, those public health advocates at the AHA seem to think that changing public health messages—even when they are wrong—confuses widdle ol’ Americans. The AHA—and the USDA/HHS team—doesn’t want us to have to worry our pretty little heads about all that crazy scientifical stuff with big scary words and no funny pictures or halftime shows.
Frankly, I appreciate that. I hate to have my pretty little head worried. But there’s one other problem with this particular Consistent Public Health Message. Not only is there no science to back it up; not only is it likely to be downright detrimental to the health of certain groups of people; not only is it likely to introduce an arsenal of synthetic chemical salt-replacements that will be consumed at unprecedented levels without testing for negative interactions or toxicities (remember how well that worked out when we replaced saturated fat with partially-hydrogenated vegetable oils?)—it is, apparently, incompatible with eating food.
Researchers set out to find what would really happen if Americans were muddle-headed and sheep-like enough to actually try to reduce their sodium intake to 1500 mg/day. They discovered that, “the 2010 Dietary Guidelines for sodium were incompatible with potassium guidelines and with nutritionally adequate diets, even after reducing the sodium content of all US foods by 10%.” Way to go, Guidelines
While these researchers suggested that a feasibility study (this is a scientifical term for “reality check”) should precede the issuing of dietary guidelines to the public, I have a different suggestion.
How about we just stop with the whole 30-year-long dietary experiment to prevent chronic disease by telling Americans what not to eat? I hate to be the one to point this out, but it doesn’t seem to be working out all that well. It’s hard to keep assuming that the AHA and the USDA/HHS mean well when, if you look at it for what it is, they are willing to continue to jeopardize the health of Americans just so they don’t have to admit that they might have been wrong about a few things. I suppose if a Consistent Public Health Message means anything, it means never having to say you’re sorry for 30 years-worth of lousy dietary advice.
Marion Nestle has noted that, up until now, “every single committee that has dealt with this question [of sodium-reduction] says, ‘We really need to lower the sodium in the food supply.’ Now either every single committee that has ever dealt with this issue is delusional, which I find hard to believe—I mean they can’t all be making this up—[or] there must be a clinical or rational basis for the unanimity of these decisions.”
Weeeell, I got some bad news for you, Marion. Believe it. They have been delusional. They are making this up. And no, apparently there is no clinical or rational basis for the unanimity of these decisions.
But, thanks to the IOM report, perhaps we can no longer consider these decisions to be unanimous.
Praise the lard and pass the salt.
Read ’em and weep: The Reader’s Digest Condensed Version of the science from the IOM report. Studies marked with an asterix (*) are studies that were available to the 2010 Dietary Guidelines Advisory Committee.
Studies that looked at Cardiovascular Disease, Stroke, and Mortality
*Cohen et al. (2006)
When intakes of sodium less than 2300 mg per day were compared to intakes greater than 2300 mg per day, the “lower sodium intake was statistically significantly associated with increased risk of all-cause mortality.”
*Cohen et al. (2008)
When a fully-adjusted (for confounders) model was used, “there was a statistically significant higher risk of CVD mortality with the lowest vs. the highest quartile of sodium intake.”
Gardener et al. (2012)
Risk of stroke was positively related to sodium intake when comparing the highest levels of intake to the lowest levels of intake. There was no statistically significant increase in risk for those consuming between 1500 and 4000 mg of sodium per day.
*Larsson et al. (2008)
“The analyses found no significant association between dietary sodium intake and risk of any stroke subtype.”
*Nagata et al. (2004)
“Among men, a 2.3-fold increased risk of stroke mortality was associated with the highest tertile of sodium intake.” That sounds bad, but the average sodium intake in the high-risk group was 6613 mg per day. The lowest risk group had an average intake of 4070 mg per day. “Thus, the average sodium intake in the US would be within the lowest tertile of this study.”
Stolarz-Skrzypek at al. (2011)
“Overall, the authors found that lower sodium intake was associated with higher CVD mortality.”
Takachi et al. (2010)
The authors found “a significant positive association between sodium consumption at the highest compared to the lowest quintile and risk of stroke.” As with the Nagata (2004) study, this sounds bad, but the average sodium intake in the high-risk group was 6844 mg per day. The lowest risk group had an average intake of 3084 mg per day. “Thus, the average sodium intake in the US would be close to the lowest quintile of this study.”
*Umesawa et al. (2008)
“The authors found an association between greater dietary sodium intake and greater mortality from total stroke, ischemic stroke, and total CVD.” However, as with the Nagata and the Takchi studies (above), lower quintiles—in this case, quintiles one and two—would be comparable to average US intake.
Yang et al. (2011)
Higher usual sodium intake was found to be associated with all-cause mortality, but not cardiovascular disease mortality or ischemic heart disease mortality. “However, the finding that correction for regression dilution increased the effect on all-cause mortality, but not on CVD mortality, is inconsistent with the theoretical causal pathway.” In other words, high sodium intake might be bad for health, but not because it raises blood pressure and leads to heart disease.
Studies in Populations 51 Years of Age or Older
*Geleijnse et al. (2007)
“This study found no significant difference between urinary sodium level and risk of CVD mortality or all-cause mortality.” Relative risk was lowest in the medium intake group, with an average estimated intake of 2, 415 mg/day.
Other
“Five of the nine reported studies in the general population listed above also analyzed the data on health outcomes by age and found no interaction (Cohen et al., 2006, 2008; Cook et al., 2007; Gardener et al., 2012; Yang et al., 2011).”
Studies in Populations with Chronic Kidney Disease
Dong et al. (2010)
“The authors found that the lowest sodium intake was associated with increased mortality risk.”
Heerspink et al. (2012)
“Results from this study suggest that ARBs were more effective at decreasing CKD progression and CVD when sodium intake was in the lowest tertile” which had an estimated average sodium intake of about 2783 mg/day.
Studies on Populations with Cardiovascular Disease
Costa et al. (2012)
“Dietary sodium intake was estimated from a 62-itemvalidated FFQ. . . . Significant correlations were found between sodium intake and percentage of fat and calories in daily intake. . . . Overall, for the first 30 days and up to 4 years afterward, total mortality was significantly associated with high sodium intake.”
Kono et al. (2011)
“Cumulative risk analysis found that a salt intake of greater than the median of 4,000 mg of sodium) was associated with higher stroke recurrence rate. Univariate analysis of lifestyle management also found that poor lifestyle, defined by both high salt intake and low physical activity, was significantly associated with stroke recurrence.
O’Donnell et al. (2011)
“For the composite outcome, multivariate analysis found a U-shaped relationship between 24-hour urine sodium and the composite outcome of CVD death, MI, stroke, and hospitalization for CHF.” In other words, both higher (>7,000 mg per day estimated intake) and lower (<2,990 mg per day estimated intake) intakes of sodium were associated with increased risk of heart disease and mortality.
Studies on Populations with Prehypertension
*Cook et al. (2007)
In a randomized trial comparing a low sodium intervention with usual intake, lower sodium intake did not significantly decrease risk of mortality or heart disease events.
*Cook et al. (2009)
No significant increase in risk of adverse cardiovascular outcomes was associated with increased sodium excretions levels.
Other
“Several other studies discussed in this chapter analyzed data on health outcomes by blood pressure and found no statistical interactions (Cohen et al., 2006, 2008; Gardener et al., 2012; O’Donnell et al., 2011; Yang et al., 2011).”
Studies on Populations with Diabetes
Ekinci et al. (2011)
Higher sodium intakes were associated with decreased risk of all-cause mortality and heart disease mortality.
Tikellis et al. (2013)
“Adjusted multivariate regression analysis found urinary sodium excretion was associated with incident CVD, with increased risk at both the highest [> 4,401 mg/day] and lowest [<2,346 mg/day] urine sodium excretion levels. When analyzed as independent outcomes, no significant associations were found between urinary sodium excretion and new CVD or stroke after adjustment for other risk factors.”
Other
“Two other studies discussed in this chapter analyzed the data on health outcomes by diabetes prevalence and found no interaction (Cohen et al., 2006; O’Donnell et al., 2011).”
Studies in Populations with Congestive Heart Failure
Arcand et al. (2011)
High sodium intake levels (≥2,800 mg per day) were significantly associated with acute decompensated heart failure, all-cause hospitalization, and mortality.
Lennie et al. (2011)
“Results for event-free survival at a urinary sodium of ≥3,000 mg per day varied by the severity of patient symptoms.” In people with less severe symptoms, sodium intake greater than 3,000 mg per day was correlated with a lower disease incidence compared to those with a sodium intake less than 3,000 mg per day. Conversely, people with more severe symptoms who had a sodium intake greater than 3,000 mg per day had a higher disease incidence than those with sodium intakes less than 3,000 mg per day.
Parrinello et al. (2009)
“During the 12 months of follow-up, participants receiving the restricted sodium diet [1840 mg/day] had a greater number of hospital readmissions and higher mortality compared to those on the modestly restricted diet [2760 mg/day].”
*Paterna et al. (2008)
The lower sodium intake group [1840 mg/day] experienced a significantly higher number of hospital readmissions compared to the normal sodium intake group [2760 mg/day].
*Paterna et al. (2009)
A significant association was found between the low sodium intake [1,840 mg per day]) and hospital readmissions. The group with normal sodium diet [2760 mg/day] also had fewer deaths compared to all groups receiving a low-sodium diet combined.