How to Choose Foods Wisely?

I don’t have the answer; I’m just askin’ the question.

I’m not much for food rules. I’m not much for rules in general (ask my mother). Still, I feel an obligation to provide some guidance that counterbalances the Government-Approved Information on Nutrition (code name: “GAIN”) that screams at us from every shelf in the supermarket.

There are a lot of “how to” guides on choosing foods wisely, from Michael Pollan’s 7 rules to the How to Find Real Food at the Supermarket from Darya Pino to a grass-fed, organic approach from Healthy Eating Politics to a more academic approach from Carlos Monteiro (scroll down to his discussion on meat and bread).

I like all of these.  At the same time, I want something I could give to patients and clients that will help them make reasonable choices—yes, even if they are buying food at a gas station. Most importantly, I want to make this something everyone can do regardless of income level. We have to acknowledge that, at least for now, many “cleanly produced” foods (grassfed beef, farmers’ market eggs, organically-raised produce, etc.) are WAY more expensive than their grocery store counterparts.  Still, I think I would recommend grocery store pork chops over organic “convenience” foods like this

even though all 25 ingredients are “organic”!! even the tofu!

Here’s my initial stab at a “choose wisely” approach. However, I think my own brain capacity is quite limited (especially when I’m trying to wrap it around biostatistics). I’d love some feedback and suggestions for improvement from the community of folks who are doing their best to “choose wisely” on a daily basis. This is not geared toward any particular “dietary approach,” although—as it happens—reducing processing tends to reduce unnecessary carbohydrates. Hmmm. How truly convenient.

If Nutrition Experts Built Bridges–

If you are an engineer, your plan—bottom line, no fudging about—has to WORK. All. The. Time. It’s what we expect from engineers.

On the other hand, if you are a Government-Approved Nutrition Expert, your plan doesn’t have to work AT ALL.

Which may be why we don’t let Nutrition Experts build bridges.

To ensure a more impressive rate of success, engineers tend to build their bridges and elevators based on a few mysterious but fundamental concepts like physics (or as we say around here, fweezix). Now, to paraphrase Barbie, I understand that physics is TOUGH. But it is also, well, insurmountably the real deal, and anything that defies the laws of physics is generally—for lack of a better word—considered to be magic.

Now, from my biochemistry classes, it looks like the principles of nutrition are built on chemistry, and the principles of chemistry are built on—you guessed it!—politics physics But when I step across the hall to my public health classes, then the principles of nutrition are based on the Dietary Guidelines, which—as they tend to be in defiance of the laws of physics—I guess must be magic!

Despite the rockin’ groove, I’m not sure that I believe in magic.

But Calories In = Calories out is not magic, it’s physics, right? It seems indisputable—a veritable law of thermodynamics—that if you consume fewer calories than you expend, you will lose weight. Conversely, if you consume more calories than you expend, you will gain weight. Duh.

Sometimes when things aren’t working (i.e. major bridge oopie ), we get a glimpse of the realities of the physics behind the system. Let’s take a look at a category of individuals that do lose weight easily—too easily: Type 1 diabetics. A type 1 diabetic could eat 5000 calories a day, never move a muscle, and still lose weight (for the record: this is not a good thing). What happens to those calories? Why don’t they get stored as fat (hello? calories IN?) A type 1 diabetic can’t store them as fat. Why not? No insulin. Without insulin, the body cannot store energy at all. Type I diabetics must be given insulin or they literally waste away. It’s not because they try harder; it’s because of physics.

What this means is that it can’t just be the amount of calories that we are consuming, but also the source. And in the case of unnecessary carbohydrates in the diet, it’s likely to be both. The increase in caloric intake we’ve seen in the past 30 years has come almost entirely from industrialized carbohydrate food products—subsidized and endorsed by the USDA.

Would obesity rates have skyrocketed without the Guidelines prompting Americans to eat fewer animal products—especially meat and eggs which contain Very Scary saturated fat and cholesterol—and more whole grain cereal products? We’ll never know. But physics does tell us that carbohydrate foods have particular qualities that affect fat storage and metabolism, specifically: “A high carbohydrate meal stimulates the production of insulin. Insulin inhibits the body’s ability to use fat for energy and stimulates the uptake of fat and its storage as triacylglycerol” (Campbell & Farrell, 2009). That’s straight from my biochemistry textbook.

Now I don’t care if you eat carbs or not. Some of my best friends are carbs. But can we stop pretending that somehow—magically—there’s no relationship between the two figures above?

Apparently we can’t. According to many Nutrition Experts, including Marion Nestle, our low-fat Dietary Guidelines can be blamed only in that they do not do more to “address caloric intake, portion size, inactivity, and other contributors to obesity” (Woolf & Nestle, 2008). Notice that “caloric intake,” “portion size” and “inactivity” are all things that are our fault—in contrast to a diet recommendation of mostly carbohydrates, something the USDA and HHS are responsible for. In other words, if chubby little Americans can’t “achieve energy balance” by eating less and exercising more, it’s not because the Guidelines aren’t helping us, it’s because we are simply not trying hard enough.

(True Confession: I mostly just wanted to draw that cartoon.)

Should we reduce our calories? Maybe not a bad idea for some folks.

What kind of calories should we reduce? Ask an engineer. Unless you believe in magic . . .

References:

Campbell MK, Farrell SO. Biochemistry, 6th ed. United States: Thomson, 2009. p. 730.

Centers for Disease Control and Prevention (CDC). Trends in intake of energy and macronutrients–United States, 1971-2000. Morbidity and Mortality Weekly Report. 2004 Feb 6;53(4):80-2.

Woolf SH, Nestle M. Do dietary guidelines explain the obesity epidemic? American Journal of Preventive Medicine. 2008 Mar;34(3):263-5.

Public Health Nutrition’s Epic Fail

Mostly I just wanted to say “epic fail” because it embarrasses my kids, but then, they are always harshing on my mellow.

The stated goals of the US Dietary Guidelines are to promote health, reduce risk of chronic disease, and reduce the prevalence of overweight and obesity.

How’s that working for us?

First the good news. Cholesterol levels and hypertension have trended downwards since the creation of our first Dietary Guidelines.

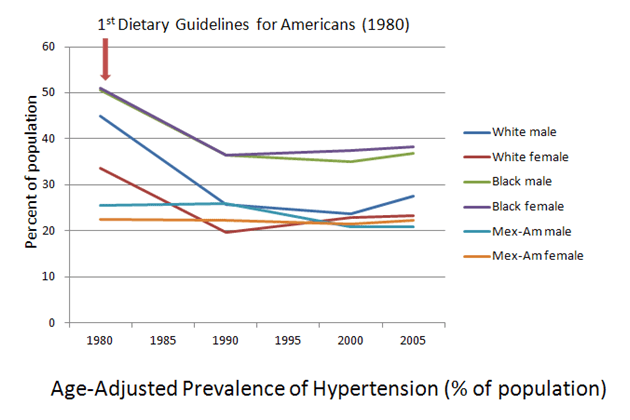
It is possible that the changes in these risk factors reflect a trend that was already well underway when the Dietary Guidelines were written . . .

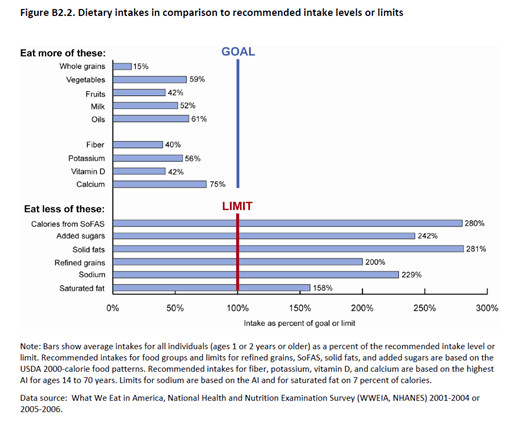
. . . although some folks like to attribute the changes to improvements in our eating habits (Hu et al 2000; Fung et al 2008). And btw, yes, they actually have improved with regards to the dietary recommendations set for in our Guidelines. Don’t believe me? You’re not alone. Here’s the data.

Soooooo . . . if our diets really have improved, and if those improvements have led to related improvements in some disease risk factors (because cholesterol levels and even blood pressure levels are not diseases in and of themselves, but markers—or risk factors—for other disease outcomes, like heart disease and stroke), let’s see how the Guidelines fared with regards to actual disease.

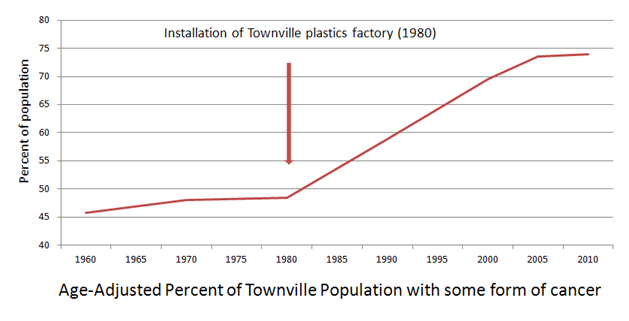
This trend is a little ironic in that cancer was, at first, one of the primary targets for nutrition reform. It was Senator George McGovern’s ire at the Department of Health, Education, and Welfare’s (now the Department of Health and Human Services) failure to aggressively pursue nutritional links to cancer that was at least part of the motivation behind giving the “lead” in nutrition to the USDA in 1977 (Eskridge 1978; Blackburn, Interview with Mark Hegsted). In fact the relationship between dietary fat and cancer had so little solid evidence behind it, the 2000 Dietary Guidelines Advisory Committee had this to say: “Because relationships between fat intake and cancer are inconclusive and currently under investigation, they are deleted.”

I guess we can then feel assured that the reason that the restrictions against fat and saturated fat are still in the Dietary Guidelines is because their relationship to heart disease isn’t inconclusive or “currently under investigation”? If that’s the case, somebody better tell these folks. So what did happen to heart disease as we lowered our red meat consumption and our egg intake, while we increase our intake of “heart-healthy” grains and vegetable oils?

Well, you’d think with all of that reduction in fat and saturated fat, plus the decrease in smoking, we’d be doing better here, but at least—well, at least for white people—the overall trend is down; for black folks, the overall trend is up.
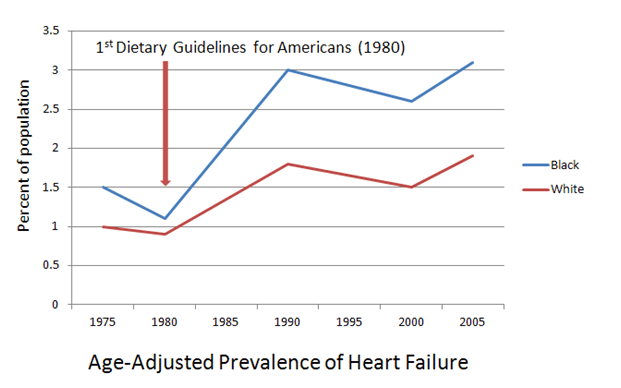
Oops. Not so good.

Hmmm.

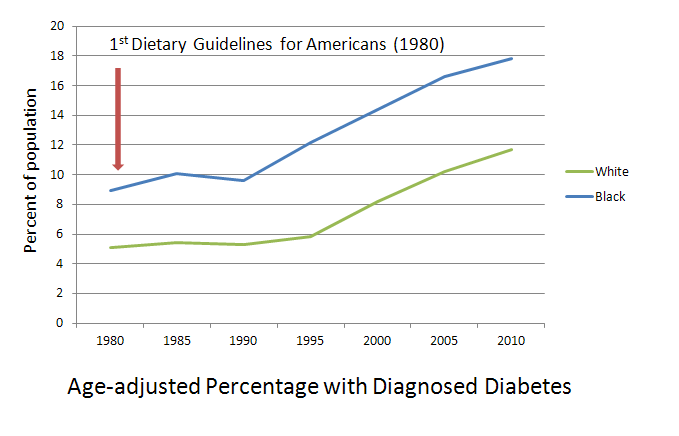
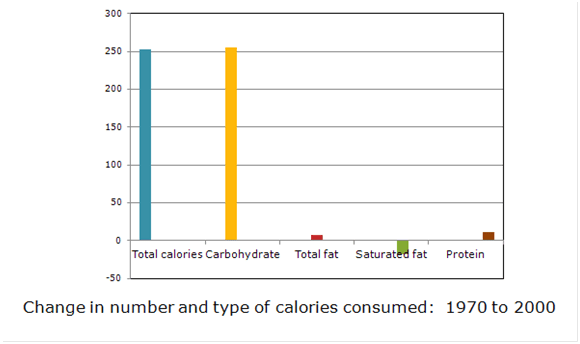
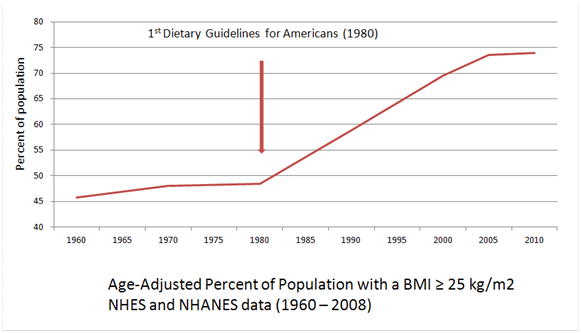
Oh. Well. This can’t be good. And of course, my favoritest graph of all:

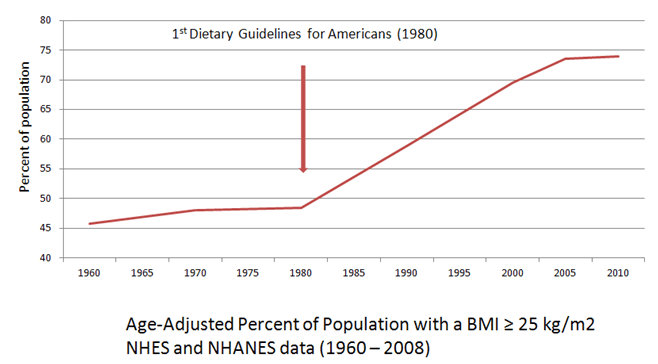
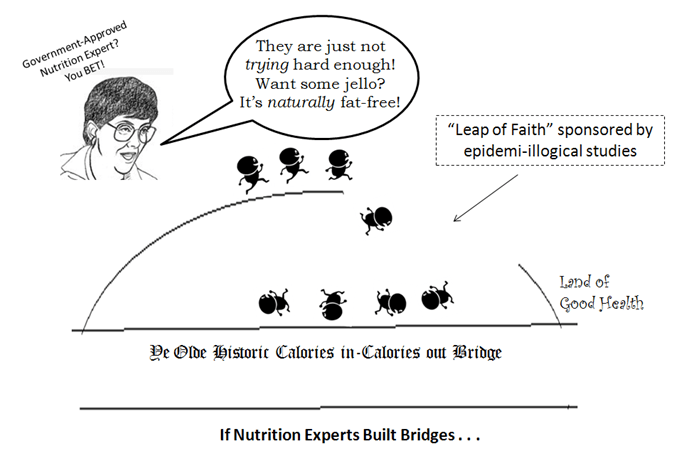
I’m not sure, but it sorta kinda looks like the Dietary Guidelines haven’t really prevented much, if any, disease. Maybe we could get those guys at Harvard to take a closer look? I mean, looking at these trends—and using the language allowed with associations—you might say that the development and implementation of Dietary Guidelines for Americans is associated with a population-wide increase in the development of cancer, heart failure, stroke, diabetes, and overweight/obesity. Anyway, you might say that. I would never say that. I’m an RD.

Are there other explanations for these trends? Maybe. Maybe not.

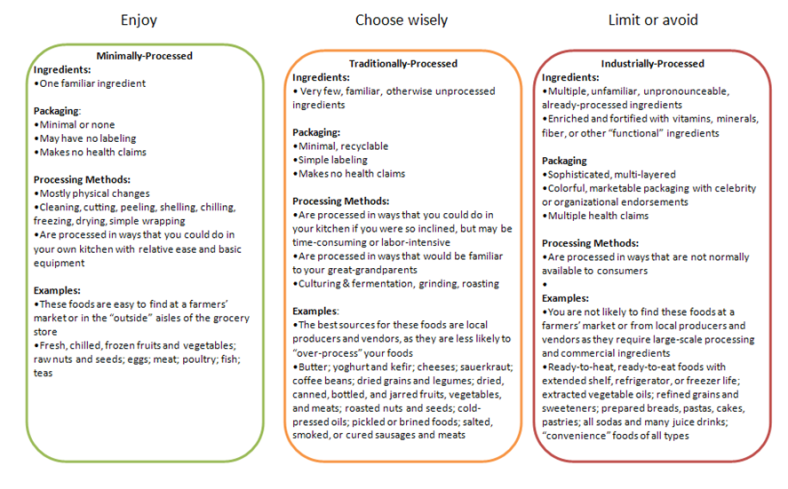
It’s always a good idea to blame food manufacturers, but we have to remember that they pretty much supply what we demand. And in the past 30 years, what we’ve demanded is more “heart-healthy” grains, less saturated fat, and more Poofas. Yes, food manufacturers do help shape demand through advertising, but the Dietary Guidelines don’t have anything to do with that.

Oh yeah. That‘s so whack, it’s dope.

References:

Blackburn H. Interview with Mark Hegsted. “Washington—Dietary Guidelines.” Accessed January 24, 2011. http://www.foodpolitics.com/wp-content/uploads/Hegsted.pdf

Centers for Disease Control and Prevention (CDC). National Center for Health Statistics, Division of Health Interview Statistics, data from the National Health Interview Survey. http://www.cdc.gov/diabetes/statistics/prev/national/figpersons.htm. Accessed 15 August 2010.

Centers for Disease Control and Prevention (CDC). National Center for Health Statistics, Division of National Health and Nutrition Examination Surveys. Prevalence of Overweight, Obesity, and Extreme Obesity Among Adults: United States, Trends 1976–1980 Through 2007–2008. http://www.cdc.gov/NCHS/data/hestat/obesity_adult_07_08/obesity_adult_07_08.pdf

Accessed February 1, 2011.

Eskridge NK. McGovern Chides NIH: Reordering Priorities: Emphasis on Nutrition. BioScience, Vol. 28, No. 8 (August 1978), pp. 489-491.

Fast Stats: An interactive tool for access to SEER cancer statistics. Surveillance Research Program, National Cancer Institute. http://seer.cancer.gov/faststats. Accessed on 11-1-2011.

Fung TT, Chiuve SE, McCullough ML, Rexrode KM, Logroscino G, Hu FB. Adherence to a DASH-style diet and risk of coronary heart disease and stroke in women. Arch Intern Med. 2008 Apr 14;168(7):713-20. Erratum in: Arch Intern Med. 2008 Jun 23;168(12):1276.

Hu FB, Stampfer MJ, Manson JE, Grodstein F, Colditz GA, Speizer FE, Willett WC. Trends in the incidence of coronary heart disease and changes in diet and lifestyle in women. N Engl J Med. 2000 Aug 24;343(8):530-7.

Morbidity and Mortality: 2009 Chart Book on Cardiovascular, Lung, and Blood Diseases. Bethesda, Md: National Institutes of Health: National Heart, Lung, and Blood Institute; 2009.

Kinky Stuff about Fatty Acids

That’s fatty ACIDS. It’s not that kind of site.

I was a young adult in the 1980s, just after the first Dietary Guidelines rocked our world. Yes, I remember the bacon-and-eggs frowny face on the cover of Times. It was in the checkout lane as I was buying my low-fat, fruit-and-sugar filled yogurt. Of course, I would soon come to my senses and switch to fat-FREE yogurt. Why? Because animal fat, including whatever remaining milkfat was in my yogurt, has Very Scary saturated fat in it. Did I know what that meant? Of course not. But I do now.

At my house, we like to joke that fats suffer from a serious PR problem (that’s what passes for humor around here). It’s so easy to think FAT=FAT. And “saturated” fat sounds even more ominous and creepy, saturating our blood with icky gooey . . . um . . . somethingy. Surely those loverly ladies Mona Unsaturated Fatty Acid (MUFA) and Polly Unsaturated Fatty Acid (PUFA)—Moofa and Poofa to friends—are better company to keep.  That seems to be what the folks at Harvard think, anyway.

Enter actual biochemistry.

In biochem class, I found out that “saturated” simply meant that the carbon chain of a fatty acid was fully “saturated” with hydrogen and therefore, there are no double bonds.  That’s not very scary.

Yeah, but my BFF, Polly Unsaturated, as it turns out, was more of a frenemy than I thought.


Kinda cute. Check out those double bonds. That’s what makes Poofa unsaturated.

Turns out, miss Poofa is into some radically kinky stuff.

Just about everyone has heard of antioxidants. They are why we are supposed to eat fruitsandvegetables. The point of antioxidants is to deal with “free radicals,” which sound like some kind of hippie flashback, but is simply a term to describe a molecule with one or more unpaired electrons that reacts easily with other molecules. In cell membranes, they can really cause problems because the long, straight profile of a fatty acid chain can get oxidized by reacting with a free radical, causing it to bend, which weakens the integrity and functionality of the membrane.

Prime targets of free radicals are unsaturated bonds, specifically: Poofas.

Even a middle-schooler can see (I know, I asked one) that this just doesn’t look good for the cell membrane.   It gets worse. The reaction that occurs not only damages that particular fatty acid, but is a self-propagating reaction. It starts and then it doesn’t stop—until an antioxidant comes along. The results: lotsa crooked Poofas.

The academic-industrial complex has recited to us the story that we should increase the consumption of corn and soybean oils—which contain about 60% of these fatty acids—because they are so good for us. They have the population studies to prove it. But this tale is as twisted as an oxidized Poofa. Ever since 1980, when we told people to start eating more Poofas, folks who are concerned about their health have eaten more Poofas. While we don’t really know if consuming corn and soybean oil will make you a healthier person, we do know that caring about your health will.  And even though people who care about their health are generally more healthy than people who aren’t, as a population we are all less healthy.  Could it be the Poofas that have saturated our food supply?

By sheer coinkydink, corn and soybean oils happen to be big moneymakers for food processors. That’s why I really get bent out of shape when we’re told that we grow soy and corn so we can feed it to cows. That’s like saying we drill for oil so we can make lipstick.

We may find out in the long run that it isn’t just our increase in carbohydrates, but our increase in Poofa–and the corresponding decrease in not-so-scary saturated fat–that is truly at the root of our current health crises. In which case, miss Poofa can kiss my butter.

Americans don’t follow Guidelines—or do they?

One of the enduring myths of our current nutrition culture is that Americans don’t follow recommendations–have never followed them–because if we had, this obesity thing wouldn’t have happened. According to the 2010 Dietary Guidelines Advisory Committee Report, “average American food patterns currently bear little resemblance to the diet recommended in the 2005 Dietary Guidelines for Americans.”

As proof, the following figure is provided:

FIGURE 1: Americans don’t follow dietary recommendations!

It seems pretty obvious that Americans are woefully off-base when it comes to eating anything close to what the USDA and HHS have been recommending for the past thirty years. I would bet my RD certification that this figure will be shown in PowerPoints across the land to demonstrate—to the accompaniment of much hand-wringing—how we must “make the healthy choice the easy choice” for those poor, dumb Americans who will otherwise just eat themselves into obesity and ruin airplane trips for the rest of us.

Aside from the fact that Americans are being evaluated on whether or not they follow the Guidelines, rather than whether or not the Guidelines are actually appropriate, there are some serious “truth in advertising” issues going on with this figure.

First, note the data collection time points: National Health and Nutrition Examination Surveys from 2001-2004, and 2005-2006. And the fun begins . . .

1) The figure shows that we eat too many calories from SoFAS. But this concept was not part of the Guidelines until the 2010 Dietary Report, the report that contains this figure. In other words, Americans are being held to standards that hadn’t even been created yet.

2) The saturated fat “cut-off” is based on a 7% of calories. The recommended limit for saturated fat at the time the data were collected and at the time this document was written is 10% of calories, not 7%.

3) The standards for whole grain consumption given in the Guidelines that the public would be familiar with when the data were collected were pretty vague: “Choose a variety of grains daily, especially whole grains” (from the 2000 Dietary Guidelines). I don’t know how this translates into an absolute amount of whole grains that Americans don’t consume.

4) The report that contains this figure (the 2010 Dietary Guidelines Advisory Committee Report) indicates that added sugars should be less than 25% of calories. Current research indicates that added sugar consumption by Americans is around 16% of total calories (Welsh et al, 2010, JAMA). According to this figure, Americans consume 242% more added sugars than recommended. Another mystery.

5) In the fine print, it says that the sodium cut-off is based on the recommended Adequate Intake (AI) amount. The AI amount is a “goal for adequate intake,” and, as such, is more of a floor than a ceiling. The AI amount is currently set at 1500 mg of sodium for adults. On the other hand, the Dietary Guidelines that were in effect at the time the data were collected set sodium recommendations at 2400 mg (2000 DGs) and 2300 mg (2005 DGs) per day.

Americans don’t follow the Guidelines–but the standards being used in a number of cases aren’t even part of the Guidelines?

Here’s a different perspective on whether or not Americans are following dietary recommendations:

FIGURE 2: Or do they? Black lines represent lower limits of Acceptable Macronutrient Distribution Range (AMDR) given in the Dietary Guidelines; red lines designate upper limits of AMDR.

Since 1980, Americans have been told to increase their carbohydrate consumption and reduce their fat intake. Since 1980, we’ve done just that. American’s consumption patterns fall within the recommended AMDR levels, with the exception of saturated fat, which—at 11% of total calories—is just slightly more than the recommended limit of 10% of calories. (If you are interested in just exactly how well Americans have complied with the dietary recommendations of the past 30 years, you can find the gory details here.)  Far from being careless and casual consumers of anything and everything, Americans have radically shifted their eating patterns to match recommendations.

So why don’t Americans get any credit for actually lowering their fat intake and raising their carbohydrate intake, as we were told to do? I think there are a couple of things behind that.

First, I think one of the purposes of information like that presented in Figure 1 is to make sure the responsibility for overweight and obesity continues to rest squarely on the chubby little shoulders of Americans themselves and in no way reflects a possible lack of appropriateness of (or—gasp!—good scientific basis for) the Guidelines themselves. This is an attitude that pervades the Dietary Guidelines.

Second, the USDA’s Center for Nutrition Policy and Promotion would really like another $9 million to “help Americans develop eating behaviors that are more consistent with the Dietary Guidelines for Americans.” It would be a little awkward to ask for a funding increase to convince Americans to follow current dietary recommendations if we were already doing that—and they still weren’t working.

This is where recommendations become fanaticism.  According to Neil Postman, “the key to all fanatical beliefs is that they are self-confirming.”  The USDA and HHS seem unwilling to even acknowledge that the dietary shift that has occurred during the past thirty years has actually been in the direction of compliance with recommendations; in fact–according to Figure 1–they are willing to fudge the numbers to prove otherwise.  That’s not nice, and it’s sure not science.

References:

Welsh JA, Sharma A, Abramson JL, Vaccarino V, Gillespie C, Vos MB. Caloric sweetener consumption and dyslipidemia among US adults. JAMA. 2010 Apr 21;303(15):1490-7

It’s not the Guidelines

One of the enduring mysteries to me about the whole Dietary Guidelines issue is the extent to which my concerns regarding their effectiveness causes some folks to question my intelligence, knowledge, professionalism, and—I think—prescription drug use.

Take the graphic above, which appears to show a relationship in time between one event (the installation of a plastics factory) and another trend (rise in cancer rates). This does not demonstrate cause-and-effect, of course, but I think that most public health officials would be concerned enough about the clear inflection point and the following steep upward trend in disease to want to investigate the potential for a cause-effect relationship, or at least begin to ask some questions.

But when the graph looks like this, it’s a different story:


Every time I show someone the above relationship, I get remarks like, but what about physical activity levels? television? women in the work force? desk jobs? automobiles? anything, anything but the Guidelines!

Keeping in mind that the obesity graph above only shows the temporal relationship between when the Dietary Guidelines were implemented and when the rapid rise in obesity took place, I thought I would look at some of the other possible causes that are invoked in the name of avoiding the possibility that we’ve been wrong about public health nutrition for the past thirty years.

It’s not the Guidelines #1: For some reason, Americans got much lazier in the past 30 years than they have ever been before.

I will say right off the bat that we don’t have a lot of clear data about physical activity levels because we didn’t really start paying attention to it until Americans started getting fat. However, the 1983 Public Health Objectives for Americans offer some insight: “The American lifestyle is still relatively sedentary. The proportion of adults aged 18-65 regularly exercising has been estimated at just over 35% . . .” [From: Promoting Health/Preventing Disease. Public Health Service Implementation Plans for Attaining the Objectives for the Nation (Sep. – Oct., 1983), p. 155].

The most recent research—2010—on physical activity levels in America paints a much different picture:


From: Adabonyan I, Loustalot F, Kruger J, Carlson SA, Fulton JE. Prevalence of highly active adults–Behavioral Risk Factor Surveillance System, 2007.

This may not be the complete story, but there is little evidence to suggest that we have become radically more sedentary since 1980. And if we have, one would have to ask just why that would occur?

It’s not the Guidelines #2: Moms went to work, leaving the kids in front of TV sets!


Labor force participation rate of women by age of youngest child, March 1975-2007

Women began entering the workforce, even with small children at home, long before obesity rates began to climb.


Labor Force Participation of Women, Married with children under age 6. From: The first measured century

It’s not the Guidelines #3: Blame television! Television came along and we all turned into couch potatoes.


Television was in over 85% of American homes in 1960, 20 years before obesity rates began to climb. (However, it is possible that MTV, which debuted in 1980 along with the Dietary Guidelines, is at the root of our obesity crisis—anything, anything but the Guidelines!)

It’s not the Guidelines #4: We used to work at physically demanding jobs!


With these wonderful graphs from the book The first measured century: an illustrated guide to trends in America, 1900-2000, by Theodore Caplow, Louis Hicks, Ben J. Wattenberg, I looked for a similar pattern to that of the obesity trend, a parallel trend that might be a primary factor in the rise in obesity in America. The dashed lines represent the beginning of the obesity measurements above (beginning in 1960), while the solid lines shows when the first Dietary Guidelines were released (in 1980). To find some sort of correlated trend, we would want to find a flat-ish sort of line between the dashed line and the solid one, followed by a steep incline after the solid line, showing a concurrent trend.   Alternately, we might look for a curve similar to the obesity one, but shifted to the left, showing a trend that preceded the obesity one.  I didn’t find either in the transition from manual labor to more sedentary jobs.

It’s not the Guidelines #5: In the past, we used to walk everywhere–or ride our scooters, or our ponies!


I grew up in the 70s.  We rolled around in great big cars without our seat belts on.  Not such a great idea, but cars were an integral part of Americans lives long before obesity rates took off.

It’s not the Guidelines #6: Some seismic shift in our eating habits made many of us gain weight at an alarming rate.


From:  Gross et al, 2004, Increased consumption of refined carbohydrates and the epidemic of type 2 diabetes in the United States: an ecologic assessment.  AJCN

Wait a minute—this looks familiar. Hmmm. Dramatic rise in carbohydrate intake? Dramatic rise in obesity! Who’da thunk? And why did we start eating all those carbs? Not because we were sitting in front of the TV while our moms went to work (we were, but that’s not why). We started filling our plates with cereals and starches because the Dietary Guidelines told us to.

References:

Adabonyan I, Loustalot F, Kruger J, Carlson SA, Fulton JE. Prevalence of highly active adults–Behavioral Risk Factor Surveillance System, 2007. Prev Med. 2010 Aug;51(2):139-43.

Gross L, Li L, Ford ES, Liu S.  Increased consumption of refined carbohydrates and the epidemic of type 2 diabetes in the United States: an ecologic assessment.  American Journal of Clinical Nutrition, Vol. 79, No. 5, 774-779, May 2004

Public Health Reports (1974-) , Vol. 98, Supplement: Promoting Health/Preventing Disease. Public Health Service Implementation Plans for Attaining the Objectives for the Nation (Sep. – Oct., 1983), pp. 1-177