In the previous episode of As the Calories Churn, we looked at why it doesn’t really make sense to compare the carbohydrate intake of Americans in 1909 to the carbohydrate intake of Americans in 1997. [The folks who read my blog, who always seem to be a lot smarter than me, have pointed out that, besides not being able to determine differing levels of waste and major environmental impacts such as a pre- or early-industrial labor force and transportation, there would also be significant differences in: distribution and availability; what was acquired from hunted/home-grown foods; what came through the markets and ended up as animal rather than human feed; what other ingredients these carbohydrates would be packaged and processed with; and many other issues. So in other words, we not comparing apples and oranges; we are comparing apples and Apple Jacks (TM).]
America in 1909 was very different from America in 1997, but America in 1970 was not so much, certainly with regard to some of the issues above that readers have raised. By 1970, we had begun to settle into post-industrial America, with TVs in most homes and cars in most driveways. We had a wide variety of highly-processed foods that were distributed through a massive transportation infrastructure throughout the country.
Beginning in the mid-1960s, availability of calories in the food supply, specifically from carbohydrates and fats had begun to creep up. So did obesity. It makes sense that this would be cause for concern from public health professionals and policymakers, who saw a looming health crisis ahead if measures weren’t taken–although others contended that our food supply was safer and more nutritious than it had ever been and that public health efforts should be focused on reducing smoking and environmental pollutants.
What emerged from the political and scientific tug-of-war that ensued (a story for another blog post) were the 1977 Dietary Goals for Americans. These goals told us to eat more grains, cereals and vegetable oils and less fat, especially saturated fat.
Then, around 1977 – 1980, in other words around the time of the creation of the USDA’s recommendations to increase our intake of grains and cereals (both carbohydrate foods) and to decrease our intake of fatty foods, we saw the slope of availability of carbohydrate calories increase dramatically, while the slope of fat calories flattened–at least until the end of the 1990s (another story for another blog post).

[From food availability data, not adjusted for losses.]
The question is: How did the changes in our food supply relate to the national dietary recommendations we were given in 1977? Let’s take a closer look at the data that we have to work with on this question.
Dear astute and intelligent readers: From this point on, I am primarily using loss-adjusted food availability data rather than food availability data. Why? Because it is there, and it is a better estimate of actual consumption than unadjusted food availability data. It only goes back to around 1970, so you can’t use it for century-spanning comparisons, but if you are trying to do that, you’ve probably got another agenda besides improving estimation anyway. [If the following information makes you want to go back and make fun of my use of unadjusted food availability data in the previous post, go right ahead. In case you didn’t catch it, I think it is problematic to the point of absurdity to compare food availability data from the early 1900s to our current food system—too many changes and too many unknowns (see above). On the other hand, while there are some differences, I think there are enough similarities in lifestyle and environment (apart from food) between 1970 and 2010 to make a better case for changes in diet and health being related to things apart from those influences.]
Here are the differences in types of food availability data:
Food availability data: Food availability data measure the use of basic commodities, such as wheat, beef, and shell eggs for food products at the farm level or an early stage of processing. They do not measure food use of highly processed foods– –in their finished form. Highly processed foods–such as bakery products, frozen dinners, and soups—are not measured directly, but the data includes their less processed ingredients, such as sugar, flour, fresh vegetables, and fresh meat.
Loss-Adjusted Food Availability: Because food availability data do not account for all spoilage and waste that accumulates in the marketing system and is discarded in the home, the data typically overstate actual consumption. Food availability is adjusted for food loss, including spoilage, inedible components (such as bones in meat and pits in fruit), plate waste, and use as pet food.
The USDA—and some bloggers too, I think—prefer unadjusted food availability data. I guess they have decided that if American food manufacturers make it, then Americans MUST be eating it, loss-adjustments be damned. Our gluttony must somehow overcome our laziness, at least temporarily, as we dig the rejects and discards out of the landfills and pet dishes—how else could we get so darn fat?
I do understand the reluctance to use dietary intake data collected by NHANES, as all dietary intake data can be unreliable and problematic (and not just the kind collected from fat people). But I guess maybe if you’ve decided that Americans are being “highly inaccurate” about what they eat, then you figure it is okay be “highly inaccurate” right back at Americans about what you’ve decided to tell them about what they eat. Because using food availability data and calling it “consumption” is to put it mildly, highly inaccurate, by a current difference of over 1000 calories.
On the other hand, it does sound waaaaaay more dramatic to say that Americans consumed 152 POUNDS (if only I could capitalize numbers!) per person of added sweeteners in 2000 (as it does here), than it does to say that we consumed 88 pounds per person that year (which is the loss-adjusted amount). Especially if you are intent on blaming the obesity crisis on sugar.
Which is kinda hard to do looking at the chart below.
Loss adjusted food availability:
| Calories per day | 1970 | 2010 | |
| Total | 2076 | 2534 | +458 |
| Added fats and oils | 338 | 562 | +224 |
| Flour and cereal products | 429 | 596 | +167 |
| Poultry | 75 | 158 | +83 |
| Added sugars and sweeteners | 333 | 367 | +34 |
| Fruit | 65 | 82 | +17 |
| Fish | 12 | 14 | +2 |
| Butter | 29 | 26 | -3 |
| Veggies | 131 | 126 | -5 |
| Eggs | 43 | 34 | -9 |
| Dairy | 245 | 232 | -13 |
| Red meat* | 349 | 267 | -82 |
| Plain whole milk | 112 | 24 | -88 |
*Red meat: beef, veal, pork, lamb
Anybody who thinks we did not change our diet dramatically between 1970 and the present either can’t read a dataset or is living in a special room with very soft bouncy walls. Why we changed our diet is still a matter of debate. Now, it is my working theory that the changes that you see above were precipitated, at least in part, by the advice given in the 1977 Dietary Goals for Americans, which was later institutionalized, despite all kinds of science and arguments to the contrary, as the first Dietary Guidelines for Americans in 1980.
Let’s see if my theory makes sense in light of the loss-adjusted food availability data above (and which I will loosely refer to as “consumption”). The 1977 [2nd Edition] Dietary Goals for Americans say this:
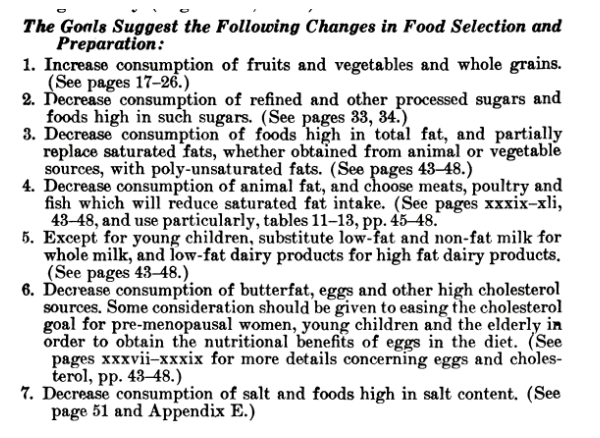
#1 – Did we increase our consumption of grains? Yes. Whole? Maybe not so much, but our consumption of fiber went from 19 g per day in 1970 to 25 g per day in 2006 which is not much less than the 29 grams of fiber per day that we were consuming back in 1909 (this is from food availability data, not adjusted for loss, because it’s the only data that goes back to 1909).
The fruits and veggies question is a little more complicated. Availability data (adjusted for losses) suggests that veggie consumption went up about 12 pounds per person per year (sounds good, but that’s a little more than a whopping half an ounce a day), but that calories from veggies went down. Howzat? Apparently Americans were choosing less caloric veggies, and since reducing calories was part of the basic idea for insisting that we eat more of them, hooray on us. Our fruit intake went up by about an ounce a day; calories from fruit reflects that. So, while we didn’t increase our vegetable and fruit intake much, we did increase it. And just FYI, that minuscule improvement in veggie consumption didn’t come from potatoes. Combining fresh and frozen potato availability (adjusted for losses), our potato consumption declined ever so slightly.
#2 – Did we decrease our consumption of refined sweeteners? No. But we did not increase our consumption as much as some folks would like you to think. Teaspoons of added (caloric) sweeteners per person in our food supply (adjusted for waste) went from 21 in 1970 to 23 in 2010. It is very possible that some people were consuming more sweeteners than other people since those numbers are population averages, but the math doesn’t work out so well if we are trying to blame added sweeteners for 2/3 of the population gaining weight. It doesn’t matter how much you squint at the data to make it go all fuzzy, the numbers pretty much say that the amount of sweeteners in our food supply has not dramatically increased.
#3 – Did we decrease our consumption of total fat? Maybe, maybe not—depends on who you want to believe. According to dietary intake data (from our national food monitoring data, NHANES), in aggregate, we increased calories overall, specifically from carbohydrate food, and decreased calories from fat and protein. That’s not what our food supply data indicate above, but there you go.

Change in amount and type of calories consumed from 1971 to 2008
according to dietary intake data
There is general agreement , however, from both food availability data and from intake data, that we decreased our consumption of the saturated fats that naturally occur with red meat, eggs, butter, and full-fat milk (see below), and we increased our consumption of “added fats and oils,” a category that consists almost exclusively of vegetable oils, which are predominantly polyunsaturated and which were added to foods–hence the category title–such as those inexpensive staples, grains and cereals, during processing.
#4 – Did we decrease our consumption of animal fat, and choose “meat, poultry, and fish which will reduce saturated fat intake”? Why yes, yes we did. Calories from red meat—the bearer of the dreaded saturated fat and all the curses that accompany it—declined in our food system, while poultry calories went up.
(So, I have just one itty-bitty request: Can we stop blaming the rise in obesity rates on burgers? Chicken nuggets, yes. KFC, yes. The buns the burgers come on, maybe. The fries, quite possibly. But not the burgers, because burgers are “red meat” and there was less red meat—specifically less beef—in our food supply to eat.)
Michael Pollan–ever the investigative journalist–insists that after 1977, “Meat consumption actually climbed” and that “We just heaped a bunch more carbs onto our plates, obscuring perhaps, but not replacing, the expanding chunk of animal protein squatting in the center.” In the face of such a concrete and well-proven assumption, why bother even looking at food supply data, which indicate that our protein from meat, poultry, fish, and eggs “climbed” by just half an ounce?
In fact, there’s a fairly convenient balance between the calories from red meat that left the supply chain and the calories of chicken that replaced them. It seems we tried to get our animal protein from the sources that the Dietary Goals said were “healthier” for us.
#5 – Did we reduce our consumption of full-fat milk? Yes. And for those folks who contend this means we just started eating more cheese, well, it seems that’s pretty much what we did. However, overall decreases in milk consumption meant that overall calories from dairy fat went down.
#6 – Did we reduce our consumption of foods high in cholesterol? Yes, we did that too. Egg consumption had been declining since the relative affluence of post-war America made meat more affordable and as cholesterol fears began percolating through the scientific and medical community, but it continued to decline after the 1977 Goals.
#7 – Salt? No, we really haven’t changed our salt consumption much and perhaps that’s a good thing. But the connections between salt, calorie intake, and obesity are speculative at best and I’m not going to get into them here (although I do kinda get into them over here).
 What I see when I look at the data is a good faith effort on the part of the American people to try to consume more of the foods they were told were “healthy,” such as grains and cereals, lean meat, and vegetable oils. We also tried to avoid the foods that we were told contained saturated fat—red meat, eggs, butter, full-fat milk—as these foods had been designated as particularly “unhealthy.” No, we didn’t reduce our sweetener consumption, but grains and cereals have added nearly 5 times more calories than sweeteners have to our food supply/intake.
Although the America of 1970 is more like the America of today than the America of 1909, some things have changed. Probably the most dramatic change between the America of the 1970s and the America of today is our food-health system. Women in the workplace, more suburban sprawl, changing demographics, increases in TV and other screen time—those were all changes that had been in the works for a long time before the 1977 Dietary Goals came along. But the idea that meat and eggs were “bad” for you? That was revolutionary.
And the rapid rises in obesity and chronic diseases that accompanied these changes? Those were pretty revolutionary as well.
One of my favorite things to luck upon on a Saturday morning in the 70s—aside from the Bugs Bunny-does-Wagner cartoon, “What’s Opera, Doc?“—were the public service announcements featuring Timer, an amorphous yellow blob with some sing-along information about nutrition:

From your head down to your feet
Thinks like meat and eggs and fish you
Meat and eggs weren’t bad for you. They didn’t cause heart disease. You needed them to build up muscle tissue and to keep you from being hungry!
But in 1984, when this showed up on the cover of Time magazine (no relation to Timer the amorphous blob), I—along with a lot of other Americans—was forced to reconsider what I’d learned on those Saturday morning not that long ago:

My all-time favorite Timer PSA was this one:
When my get up and go has got up and went,
I hanker for a hunk of cheese.
Or any time I’m weak in the knees . . .
In the 80s, when I took up my low-fat, vegetarian ways, I would still hanker for a hunk of cheese, but now I would look for low-fat, skim, or fat-free versions—or feel guilty about indulging in the full-fat versions that I still loved.
I’m no apologist for the food industry; such a dramatic change in our notions about “healthy food” clearly required some help from them, and they appear to have provided it in abundance. And I’m not a fan of sugar-sweetened beverages or added sweeteners in general, but dumping the blame for our current health crisis primarily on caloric sweeteners is not only not supported by the data at hand, it frames the conversation in a way that works to the advantage of the food industry and gives our public health officials a “get out of jail free card” for providing 35 years worth of lousy dietary guidance.
Next time on As the Calorie Churns, we’ll explore some of the interaction between consumers, industry, and public health nutrition recommendations. Stay tuned for the next episode, when you’ll get to hear Adele say: “Pollanomics: An approach to food economics that is sort of like the Field of Dreams—only with taco-flavored Doritos.”

I’ve had an interesting discussion on Facebook about this article, and I think the reasoning that “sugar hasn’t increased while grains have” is wrong, and it’s because of High Fructose Corn Syrup. HFCS would be sold on the commodities market as corn (since it’s pre-processing), so that massive increase in grains is actually a massive increase in sugar.
HFCS is accounted for in ERS food availability data under sugar and added sweeteners. Which isn’t to say that there aren’t other screwy things going on in the data, but this would just be speculation at this point.
However, I will make this point again: We have NEVER considered added sugar in any form to be something that people should consume MORE of; public health nutrition guidance–not to mention moms & dentists all over America–have warned of the dangers of excess sugar consumption since long before the Dietary Goals and Guidelines. But with the Goals and Guidelines, we were told to consume more “carbohydrate” (which is somewhat confusing since we were also told to consume less sugar), specifically in the form of grains and cereals. There is little doubt from any data collection standpoint (food availability or consumption) that our food choices have taken a turn in that direction since 1980.
“I feel fairly confident in saying that the original 1977 Goals were not shaped by industry. … But they did align well with Earl Butz’s policies and … with the “natural foods” movement already underway and were, I think, very much a product of it. … So there were a lot of cultural, political, and economic forces in play (the natural foods movement was an economic engine of its own) that shaped the creation of the Dietary Goals.”
This dovetails with my recollection of the Dietary Goals. In 1977, I was working as a publicist for the Cooperative Extension Service in southern New Hampshire, where, among other duties, I wrote articles for local newspapers about Extension Service programs and helped organize and publicize a local farmers’ market. The food I cooked and ate at home came from a local health-food store and a local fish market, and from farmers’ markets in season. As part of my job, I attended a regional meeting in Boston that introduced the Dietary Goals. Margaret Heckler was one of the speakers, and I think people from Tufts and Harvard spoke as well. A boxed lunch was served to the attendees. I don’t remember exactly what was in it, but I do remember it seemed similar to what was considered “health food” from that time, inspired by the likes of Adelle Davis and Frances Moore Lappe.
Phyllis, this is fascinating.
I’d love to hear more, about your job and your insights into that transitional period. If you have some time, please feel free to contact me at my gmail address: adele.hite.
“Our gluttony must somehow overcome our laziness, at least temporarily, as we dig the rejects and discards out of the landfills and pet dishes—how else could we get so darn fat?”
I know this isn’t what you meant, but just for fun I can’t help saying (or, rather, confessing & admitting):
I have most definitely retrieved food from the garbage, usually in the form of cake or pie with only a couple of bites taken. Come on, we’ve all done it! (Or is it just me? … *Crickets.*) If it’s right there on top and is barely touching anything else? My friend discovered the secret: you have to spray it with Windex and mash it up. No sugar craving is enough to make you eat *that.* (But no, I can’t say I’ve ever gone a landfill and snatched back someone *else’s* half-eaten cake.) 😀
On a more serious note, I’m glad you’re addressing the waste/spoilage issue. There is NO WAY Safeway is unloading all that swiss chard before it dies! (Not to mention all the processed foods with “expiration dates” — nothing but a trick to get you to consume foods before they “go bad,” and you’ll go back to the store to buy more when the box is empty. Never mind that those foods *never* expire. They’re hermetically sealed and preserved beyond all recognition that after the nuclear holocaust, there’ll be nothing left but cockroaches and Pop-Tarts. [And then the roaches will starve b/c they’re too smart to eat Pop-Tarts.])
If you’ve been keeping up with your reading, you’d know that in my house growing up, food was never thrown away–ever. It would just become soup.
I’m not as bad as my mom, but perfectly good cake would never make it as far as the garbage can. If I was trying to beat back my ever-expanding waistline and there was cake in the house, the diet would have to wait until the cake was legitimately gone. I was–am–famous for driving baked goods to other people’s houses to unload them because I couldn’t bear to throw them out.
I do remember the days before expiration dates on packaged foods, and I remember thinking, when they were instituted, that it seemed to be a way to move more product. We have a serious issue with food waste in this country & it doesn’t get talked about nearly enough.
If the Americans are consuming so much non- and low-fat dairy, then where does all the butter go? Added to other foods, exported, animal fodder, bio-diesel?
Much of it does seem to go into cheese (i.e. process cheese and its relatives) and other processed foods. Also, we apparently do export a lot of butter. There are other uses for butterfat/milkfat, but according to one source, milkfat has the disadvantage of both high price and limited functionality compared to vegetable fats and oils. However, new processing methods are overcoming some of its limitations, and researchers are also looking at non-food uses for milkfat.
Looks like exports are just a few percent. So in the end you are still eating it and then I would argue that it makes no sense to remove the fat from the milk and eat it in something else later.
What brilliant logic. Please, when you hear me repeat that later as if I thought of it, keep me honest.
While I have no desire to blame the obesity epidemic on sugar, I must say I am very skeptical about the ERS estimates of only 34 additional sugar calories per day after 40 years. Like you, I was around in 1970 … long before Big Gulps. Are all the sugar calories being ingested in sweetened beverages really being displaced by reduced sugar elsewhere in the diet?
I wonder about their methods for computing HCFS use — “ERS estimates deliveries of corn sweeteners (high-fructose corn syrup, glucose, and dextrose) for domestic food and beverage uses (excluding nonfood uses), using information from industry contacts, consulting firms, and Census Bureau import data” — compared to sugar beet processors and sugarcane refiners who provide monthly delivery reports as “required by law.”
Sounds a little like apples and Apple Jacks to me.
Not that it helps, I have to say that I had some skepticism around these figures as well. I first became aware of this apparent discrepancy between the dominant public health messaging and the data from the 2010 Dietary Guidelines for Americans Advisory Report (Part D, Section 1, p. 10). But the ERS data seemed to confirm the fact that added sugars/sweeteners were not where the biggest jump in calorie supply occurred. I too had some concerns about the data source. This in particular gives the impression that the beverage industry is actively hiding something:
Data for carbonated soft drinks (1947-2003) are from the Census of Manufactures, replacing data previously provided by the Beverage Marketing Corporation of New York. At their request, ERS has removed the Beverage Marketing Corporation’s data series on carbonated soft drinks, bottled water, fruit drinks, and vegetable juices from the website and thus no longer provides this data in the Food Availability (Per Capita) Data System.
Upon closer examination, it means that the data for those years no longer comes from the beverage industry, but from the Census of Manufactures. I have no way of determining if this would make the data more or less accurate–or if it matters that one point of comparison is within that time period and the other isn’t, but at some point, the data is the data. As researchers, we all work with essentially the same material, and if you don’t wish to believe consumer intake reports, you’re stuck with this. (And I’m not saying that the soda industry isn’t still hiding something, but if we single out a particular category to deem “unreliable,” I am concerned that this says more about our own preconceived notions about what we think the data “should” say than the data itself.)
There are of course, other considerations, such as what the biological effects of the increase that is reported would be. In terms of impacts on obesity and chronic disease, there seems to be a difference in sweeteners in liquid form vs. as solid food, at least this was clear from clinical practice, so it may be that if the increase in sugar (distributed unevenly throughout the population) in that form has been especially problematic. It may be that even this smallish increase in sweetener has been particularly devastating to a population already vulnerable due to epigenetic or environmental impacts, such as increase in grain and cereal consumption or environmental toxins. And, as Robert Lustig has argued, it may be that the effects of fructose are especially detrimental to metabolism and that even a slight increase in fructose consumption would be particularly detrimental. Of course, it may also be argued that if glucose (with its effects on insulin and potential addictive properties) is the problem, then starch has more glucose than sugar, so maybe starches are a bigger problem (and there are a lot of them in our food supply).
There are cultural considerations as well. While we can point to Big Gulps, etc. there has also been a tremendous rise in diet sodas, bottled water, and other specialty drinks (especially ones that use fruit juice as sweeteners, which are not considered “added sugars/sweeteners” at this point). In addition, and perhaps more importantly, most mothers would agree that feeding a child a can of soda for breakfast is a bad idea, but a thoughtful mother might feed her child a bagel, (which is going to have far more glucose than the soda, if glucose is the problem), maybe with some 100% juice, sweetened only with pear juice concentrate (that’s a bunch of fructose, if fructose is the problem), and she’ll think she’s done a pretty good job of it.
I just think there are curious data points on the entire table, though the sugar one just really strikes me as odd. Only 34 cals/day more since 1970? Really?
But as far as the other categories, on the one hand, my understanding is that your theory is that we stopped eating meat, and full fat dairy, and eggs as a result of the low-fat dietary guidelines and replaced it with the grains we were encouraged to eat, right? Yet if you look at chicken vs red meat as a swap, the change in dairy and eggs seems pretty underwhelming. This table suggests that the real problem is that we got a whopping amount of added fat with those grains we started consuming, but not as a replacement for anything! Kenny (below) may be on to something.
On the other hand (and I know you said someone would raise this issue), perhaps the real challenge is teasing out an issue that does not appear as marked when you look at national per capita data. Stanford’s Christopher Gardner ATOZ study revealed something pretty interesting re diet performance and insulin sensitivity when he looked at the outliers in his participants.
No, I don’t think I’ve avoided the added fat issue. In my defense:
“What I see when I look at the data is a good faith effort on the part of the American people to try to consume more of the foods they were told were “healthy,” such as grains and cereals, lean meat, and vegetable oils.”
We were encouraged to “replace” the saturated fats we were now supposed to be avoiding with vegetable oils. Now, the fact that we went on to “replace” and then some has certainly added a lot of calories to the system that weren’t there before. Whether or not we could have added as many of these calories without having cheap–and certified as “healthy” by the USDA–grain/cereal vehicles for them to ride in is a question for the ages. We simply have no way of answering that unless those grains/cereals start to exit the system and we see what happens.
My primary point is that our food supply was responsive to consumer efforts to follow national dietary recommendations (or however you want to arrange those directional arrows). I think this is reflected in the things that went up (veggie oil, grains/cereals, poultry) as well as what went down (red meat, eggs, butter, dairy). Sugar (and “solid fats,” meaning saturated fats – but not added fats) take a lot of the heat in the current public health message machine for being the source of our health problems, but sugar does not seem to have gone up all that much (and saturated fat seems to have stayed about the same, while monos and polys have gone up with increased veggie oil consumption).
The data here make absolutely no discernment between fat/carbs/calories as a cause for our current health crisis; they all went up. The rise in carbs follows the calorie (and the obesity) curve more closely, as the biggest jump in fat intake occurred around 2000, which is suggestive of what we know about the effects of carbohydrate on fat storage but–again–it all went up. As to the outliers, I hope that ultimately the outcome of all of this yammering on my part is a movement toward a federal nutrition policy that brings our primary attention to assuring that nutritional essentials are met first before we start trying to prevent diseases we barely understand using food components that are small parts of a complex system. The government’s job is to provide accurate information on health-related issues so that consumers can make the choices that are best for their own health goals. In regards to nutrition, we’ve sort of blown it.
So I actually think we’re closer in agreement than our comment back and forths might suggest. I suspect that we’re relatively on the same page wrt the problematic foodstuffs. Where we apparently differ is on who is the bigger agent: the government with their not particularly science-based dietary guidelines or the food industry in their efforts to drive profits. Or maybe it’s actually someone else, like Earl Butz with his agenda re corn? Are there others? And more importantly, how do we walk ourselves back from the precipice? I mean, have you seen our Congress in action lately?! Yikes.
No, I don’t think we are too far apart on these issues either. “The bigger agent” question is the same one my friend Garret Broad (of our Vegan-Omnivore Alliance) and I have been tossing around–and something I’m going to poke at in my next post–although I don’t really think there is an answer, nor do I think we necessarily need to pin one down, as you’ve suggested.
I feel fairly confident in saying that the original 1977 Goals were not shaped by industry. Nick Mottern seems to be pretty clear on that, and I have never found any evidence otherwise. But they did align well with Earl Butz’s policies and when–in a move that came with the 1977 Farm Bill and which was not (that I can tell) directly linked to the Goals–the USDA became the center of nutrition advice for Americans, the agency was pretty much handed the opportunity to ensure that dietary recommendations and agricultural interests remained aligned. The Goals also aligned well with the “natural foods” movement already underway and were, I think, very much a product of it. Ancel Keys and the AHA certainly influenced scientific thought and lent support to the notion in the natural foods movement that “what’s good for the planet is good for you.” So there were a lot of cultural, political, and economic forces in play (the natural foods movement was an economic engine of its own) that shaped the creation of the Dietary Goals.
Then, it gets interesting.
How to step away from the precipice? I don’t really know, but I think I must involve a different way of defining “healthy” food. As long as food manufacturers can take any mixture of vegetable oils and grain/cereals and tweak it with added fiber, vitamins, minerals, a little soy protein, some artificial sweeteners and salt substitutes, plus whatever other colors/preservatives/stabilizers/flavorizers/etc. they can get away with and still be able to plaster health claims (or, these days, a big “all-natural”) on the front, or get a “green light” label, or the right profile on the nutrition facts panel (which people do read), then consumers–confused, busy, hungry–are going to be duped into believing what they are purchasing is “healthy” because–in fact–the government has deemed it so.
And that’s pretty much my next blog post right there.
This is a purely anecdotal perspective, but I’m not so sure the sugar estimates are off. I remember that in 1970 we rarely drank soda, but on the other hand we went through a pitcher of sugar-sweetened Kool-Aid every summer day, we drank sweetened orange juice, and sprinkled sugar on our cereal and grapefruit. Almost every dinner included a dessert of some kind: Jell-o, pudding, cake, or pie. So I can see a situation where people started avoiding desserts – whether for the sugar or the fat – and using artificial sweeteners, thus bringing their daily sugar consumption down quite a bit, which was then later balanced by an increase in Big Gulps, which brings us back to about the same. We just shifted around the sugar.
Gingerzini – That matches my recollections pretty closely, except that in the South here, we drank sweet (iced) tea and in many restaurants that was the only option you could get. The dessert thing especially has changed. My neighbor’s mom, a good old-fashioned Southern cook, would not consider dinner to be complete without a dessert (and likely one of the ones you mentioned).
In many regards, we did seem to get the sugar message right along with the fat message, but with the help of a cheap supply of HFCS and corn oil, the sugar and fat just appeared elsewhere in the food supply.
I think we eat more now than 1970 because we are hungrier.
Did following the Guidelines make us hungrier? Hmmm….
Goodbye
Helloappetite control?Not only do we have taco-flavored Doritos, we now also have cool ranch locos Doritos-flavored tacos.
LOL – so true! One of the few pieces of dietary advice I give out willingly is “whatever your first meal of the day is, make sure it has sufficient protein.” For many people, that’s the only advice they need. Their appetite is under control, they aren’t hungry until many hours later, snacking is unnecessary and the rest of the day unfolds as it should.
29-26 calories from butter? That’s only about a teaspoon a day. Shame on you America.
Shame. Surely you were raised better than that.
The good news is that our 2010 high butter mark of 26 calories/person/day is an improvement over our measly 21 calories/person/day in 1990. But we can do butter than that, America! Everybody out there–put some butter on your butter!
Already on it.
Gosh it seems like I eat so much butter it oozes out of my skin.
Keep up the good work. You can rest easy knowing you’ve done your part.
I’ve heard people ask Mary Vernon about how she keeps her skin so gorgeous (it is enviable), and I’ve heard her try to explain that is isn’t the lipid solutions she puts on herself, but the one she puts in herself that really matters. But she doesn’t ooze anything except intelligence (maybe it’s the brand of butter she buys?).
Could we use isotopes in bones to constrain the estimates of what we have been eating? (From people who died young to get a higher temporal resolution.)
Is taking spoilage in account important for the trends or only for the absolute levels?
Good questions. As for isotopes, you’d have to dig up a lot of bodies to get a large enough dataset to be representative of the population over time–I can’t see this happening in reality.
As for the spoilage question, I think availability data, loss-adjusted or otherwise, as well as intake data should probably be looked at as indicative of trends rather than absolutes anyway (although I am certainly guilty of using it as such). Both approaches have considerable potential for error.
What we THINK we know and what we actually know (or should know) are usually miles apart. Everyone KNOWS that we move around less these days because of all the modern conveniences and that this is a contributing factor to obesity, and yet I’ll bet more people nowadays exercise MORE frequently and MORE vigorously that the average person did in 1950 … and we have the gym memberships to prove it.
And I’ve never understood why it’s “bad” for a kid (or adult, for that matter) to sit in front of a computer screen or a TV screen, and yet it’s “good” if they sit reading a book or doing homework.
“Like”
They usually aren’t eating a full meal while they’re doing homework or reading a book, or at least receive the same kind of stimulation as they would from being in front of a screen of some sort. And if they did, they probably eat alot slower (and likely better in terms of quality of snacks at the time).
“They usually aren’t eating a full meal while they’re doing homework or reading a book”–says who? My son’s “afternoon snack” which looks a lot like a complete meal is typically snarfed down while he reads (book held open with clean table to leave both hands free for shoveling food in gaping maw). This is no different from what my siblings and I did back in the day.
One of the key preliminary findings from the Early Bird Diabetes Study (monitoring obesity and metabolic changes in children) is this: “Obesity leads to inactivity, rather than the other way round. Time-lag analysis from one year to the next suggests obesity comes first.”
Gym memberships–and $200 athletic shoes, weird bras, mountain bikes, and bad knees to prove it.
My mother, along with many other mothers in the 70s, would kick all the kids outdoors on Saturday (ostensibly so they could clean, but I suspect they just poured themselves some wine and caught up on their back issues of Ms). I’m not sure what my siblings did; I just sat on the front steps and read until we could go back in the house.
Hmmm…there’s no button for me to reply to the comment where you quoted this: “Obesity leads to inactivity, rather than the other way round. Time-lag analysis from one year to the next suggests obesity comes first,” so I’ll do it here.
This is what Gary Taubes means when he says things like “People don’t get fatter because they’re more sedentary; they’re more sedentary because they’re getting fatter.” That is, whatever mechanism is causing someone to store fat is obviously storing that fat rather than letting it be utilized for fuel. No fuel = no energy. No energy —> preference for sedentary activities that don’t *require* a lot of energy. One of the most commonly reported (beneficial) side effects of a low-carb diet in obese people is a huge boost in energy levels. Which leads me back to something else Taubes is fond of pointing out: People aren’t losing fat because they’re exercising; they’re exercising because they’re losing fat.” When the body finally gets into a metabolic state where all its rich, lush, fuel (stored body fat) is *available,* people almost can’t *help* but move around more, whereas before it took all the energy they could muster just to get up the stairs. I know Taubes’ work is getting a bad rap in some circles these days, but I think he’s spot-on.
I disagree with Gary a lot about stuff, but it is nice when mainstream science confirms his theory about what many of us who have struggled with our weight–or worked with people who have–already know. We had a “no exercise” policy at the clinic, which doesn’t mean we insisted that people NOT exercise, just that we let them know that exercise was not necessary for weight loss or improved health. Many patients would come to us saying, “Whatever you tell me, just don’t tell me to exercise. I can’t/won’t do it.” The fun part was when, a few months in, these patients who were opposed to the notion of exercise suddenly had more energy than they knew what do with–and asked us for exercise recommendations.
I remember one gentleman who said, “I’ve cleaned out the garage, the attic, the gutters, and the junk room. My wife won’t let me paint the house. I need an exercise program.”
RIGHT ON! It’s a moral judgment. I was a chubby little kid who constantly had my nose in a book. Should I have gone outside to play more than I did? Yes. But I don’t think I’ve ever heard anyone say that kids should read less. (Or study less, write less poetry, do fewer science experiments while seated at the kitchen table, etc.) We can debate the intellectual merits of TV and Facebook versus reading and writing, but if we look at it in terms of being sedentary and nothing else, the only difference there is in how our culture perceives those activities.
You got it. And I was a skinny little kid with my nose in a book. Today, which of us would be a target for lectures about sedentary behavior?
This is exactly what I see in working with the senior population. They have followed the suggested guidelines… To find one that eats more than one whole egg per day is rare, and to find one that eats red meat more than once every few weeks even more rare.
So sad. Dietitians who work with elderly populations can tell you how older adults will “perk right up” with steak and eggs for breakfast.
I’ve worked with seniors and I find they rarely care at all about the guidelines and avoiding fat. And usually hold anti-government sentiments as far as trusting what they have to say anyway. But sugar and cooking with flour and added fat/oils (both butter and vegetable oils) do tend to be a problem.
But I’m in the South, so it could also be a regional/cultural tendency (Southern fried foods, attitudes about government, etc.)
I’m in the South too, and I suspect there are some regional differences in attitudes toward food and government directives. There are also bound to be differences with regard to when you encounter those folks. Maybe some have had health scares themselves or in their family and the desire for change has been there for a while–or maybe not.
There is no doubt that the majority of Americans believe that saturated fat “causes” heart disease (the number is usually over 75% across a range of surveys & populations) despite the absence of conclusive data to indicate that this is in any way true. I think there’s more disagreement around the existence of extraterrestrial visitations than there is around the dangers of saturated fat, with both being about equally plausible. How people choose to act on this belief (sat fat, not aliens) is a different matter.
Yeah, I have a unique spot maybe. I teach a few weekly health classes (this means they want to be healthy) and they’re overweight/diabetic and yet… they are shocked when I tell them what I eat (butter, eggs, beef, bacon)… many of them have truly given up those foods, or at least severely restricted them.
I don’t see that the senior population wastes any time with following suggested guidelines. Just the opposite, in fact … unless the food is prepared for them by younger people who “know better.”
My 64-year-old sister (mentally and physically handicapped) lives in a group home and has a lot of health problems, including early-stage diabetes. The staff at the home makes sure she gets a low-fat diet and limits her sugar (but only in the form of pastries, ice cream, candy, etc., no limits on healthywholegrain breads or starches or packedwithVitaminC orange juice, of course). They weigh and measure everything for her. For themselves, though, I see them sitting right beside the residents, hoovering up buckets of KFC, huge portions of Chinese and Mexican takeout, etc.
Funny how strict they are with her meals, and not at all with their own. Talk about double standards.
It reminds me of those people who meticulously obsess over their pets’ diets, putting them on near-vegetarian “weight management” foods, feeding them carrot sticks rather than beef treats, all to keep them fit and trim. Yet they themselves are grossly obese. It’s like if they can’t control their own eating, they’re darn sure going to control someone else’s eating.
Not sure what your sister’s situation is, but if there is any state or federal support–or if there is a licensing organization, etc.–there may be nutrition standards, for which the Dietary Guidelines are the template of course, that are to be followed.
There are all sorts of situations where the DGs form a sort of trickle-down nutrition economy.
Yes, it’s a state-run agency and they have to follow those rules, which of course dictate low-fat and higher-carb for diabetics (I once calculated a typical day, and she’s getting close to 200 grams of carbs daily). I just think the double-standard and the “do as I say, not as I do” attitudes are frustrating.
Only 200! They are way below average then. Wish I were joking about that.
I understand your frustration. What I see in that situation is the freedom of one group of people to eat as they see fit (for better or worse), and the constraints on another group of people who are forced, by virtue of their situation in life, to follow dietary standards that are arbitrary, ineffective (at best), unscientific, and which, depending on the person, may decrease their quality of life, both in terms of enjoyment of food and long-term health. That’s just wrong.
Nice post Adele. Q: Why did carb intake go DOWN so dramatically between 1909 and 1957? Did people’s health improve during these years?
And total energy intake was ~500 cals more a day – had this not occured would we still have seen a rise in obesity? My guess is yes, but to a lesser degree.
And you know what Dean Ornish and others of his ilk would/will/do say, Americans are fat and diabetic today because they have NOT decreased their fat intake enough.
But…
Can’t wait for your Pollanomics. He means well but just doesn’t really get it.
Why did carb intake go down between 1909 and 1957? We’re not really sure, but my theory is that as we became a wealthier, post-industrial (and post-Depression) country, we stopped relying as much on the sources of energy and protein that all poorer nations use–such as bread, potatoes, and rice and beans, which also happen to be higher in carbs–and we also consumed less food in general because we were less active due to changes in labor and transportation. Using food availability data (not loss adjusted, so take it for what it’s worth), the calories in our food supply from 1955 to 1965 were lower than they had been during the Depression (although probably much more equally distributed).
“He means well but just doesn’t really get it.” Yup. I fear he’s become one of the “experts” he warned us about 🙂